
Gritty Graphs - Narendra Modi vs Dr. Manmohan Singh
This week kicked off with a really interesting graph from the Economist titled Ten charts compare Joe Biden’s record with Donald Trump’s. You can find it here. The article compared Joe Biden's presidency with that of Donald Trump using ten charts. The charts cover inflation, economic performance, employment rates, federal budget deficit, stock market performance, crime rates, climate change policies, oil production, and immigration. This gave us an idea: why not try to do the same thing with India’s last 20 years and try to understand the differences between the Narendra Modi years and the Manmohan Singh years?
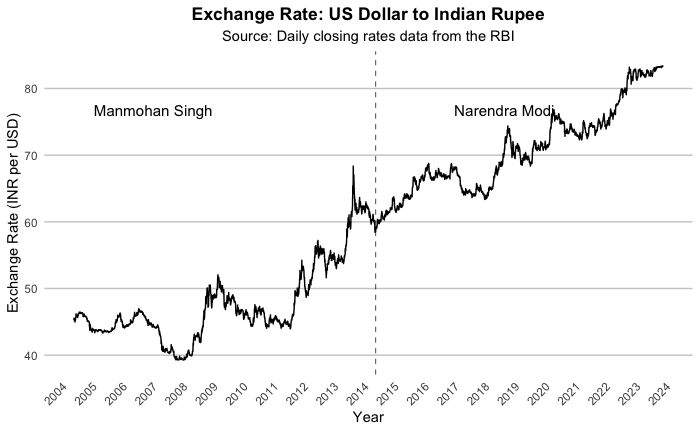
While we did try quite a bit to get high frequency data, we found out that a lot of it is behind some form of paywall or service. Therefore, we fell back on our trusted RBI to get data on India’s currency exchange rate. Given this was the subject of much debate on national pride nearly a decade ago, we thought it may be a fit case to talk about some basics.
Source of the data: dbie.rbi.org.in
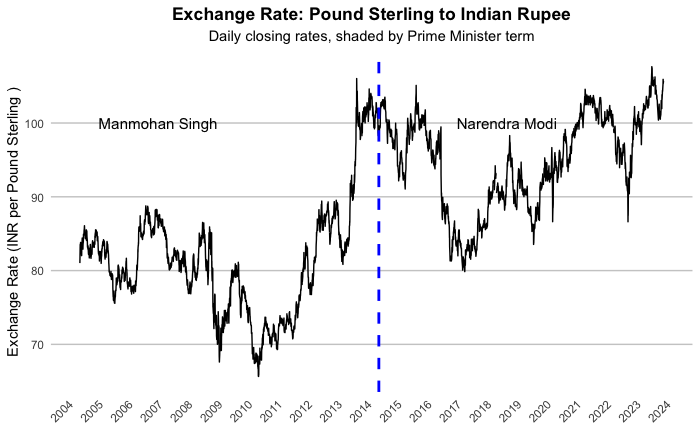
We could also do a similar exercise with the Pound Sterling, Euro, and Japanese Yen.


While these charts look impressive and can communicate much data in one place, it may still be a little difficult for us to compare how different each of the four currencies performed viz a viz the Indian rupee.
One way to over come this is to present multiple variables together by plotting them together on the same chart. For example, you can do it this way:
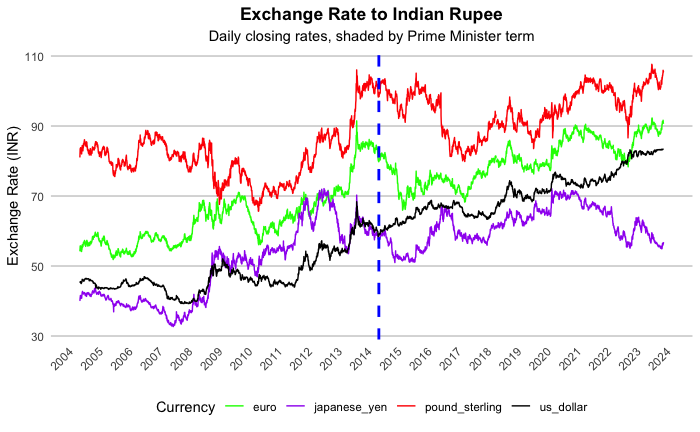
There is no denying that this chart is visually very dense, with four different currencies plotted on the same graph, each with its own colour. This can be especially confusing if the lines cross over each other frequently.
One way to overcome this is by faceting. Faceting is a process of making multiple charts appear together. This makes it easier for us to compare them together.

By separating each currency into its own panel, we have now eliminated the visual clutter present in the previous chart. This layout allows for a focused analysis of each currency's trends over time without the distraction of overlapping lines.
Each subplot clearly displays the exchange rate movements for one currency, and the addition of a vertical line indicating the transition between Prime Minister terms provides a useful reference point for analyzing potential shifts in policy impact.
Whatever said and done, the last decade has shown that there is absolutely no relationship to a nation’s growth to the conversion rate of a currency. Linking currency to a nation’s pride is simply not a very logical thing to do. The notion that a country's economic health can be directly inferred from its currency exchange rates is a misconception.
Over the last decade, we have seen that the exchange rates of the India Rupee was influenced by various factors such as trade balances, interest rates, tourism, geopolitical stability, and market speculation, among others. These factors can often have counterintuitive effects on the perceived value of a currency, and the macroeconomists are still clueless sometimes (before you go guns blazing, have a look at this:
Tethering national pride to the ups and downs of currency exchange rates is an interesting narrative that got hijacked politically. A strong currency does not necessarily mean a robust economy, nor does a weak currency imply economic malaise. Japan, for example, has long thrived with a relatively lower-valued yen, which has bolstered its export competitiveness. Conversely, countries with rapidly appreciating currencies can find their export markets suffering as a result.
A useful analogy would be a stock's price. Simply because the price of one stock is higher in the market, it does not mean it’s performing better than a lower priced stock. It is vital to look beyond just the price of a single stock, but look at things like P/E ration, number of shares outstanding and so on.
If anything, this persistent economic myth can now finally be laid to rest.
Until the next episode everyone!!
Here’s the RCode: https://github.com/drkbhere/Gritty-Graphys-002-Modi-vs-MMS