
Gritty Graphs - The Social Media Revolution
In this week’s episode of Gritty Graphs, we will discuss the rise of social media. There’s a reason we're addressing this topic now: this week marks the 20th anniversary of Facebook. The Economist published an article this week that provides an exposé on how social media has evolved over the past two decades, highlighting Facebook’s pivotal role in this transformation. The piece also discusses how Facebook was not the first social media site, shedding light on Myspace and other predecessors. It also talks about how video has quickly taken over social media and how other platforms (such as TikTok) have taken social media to the next level of immersion. It’s a fascinating read, especially considering that most of you (my beloved readers) were born around the same time Facebook was launched, with your lives closely paralleling this narrative. So, let's begin and make it interesting by infusing our discussion with data!
It turns out there isn’t a wealth of data available that encompasses the last 20 years. Therefore, we have pieced together information from two sources we believe are credible. We’re merging data from Demand Sage and Yahoo Finance to accomplish this task.
You can find the consolidated datafiles in the GitHub repo found here.
library(tidyverse) #loading the packages that we need

facebook_data<- read.csv("data.csv") #getting the data into the environment

ggplot(facebook_data, aes(x=year, y=users.millions))+geom_line() #plotting the basic plot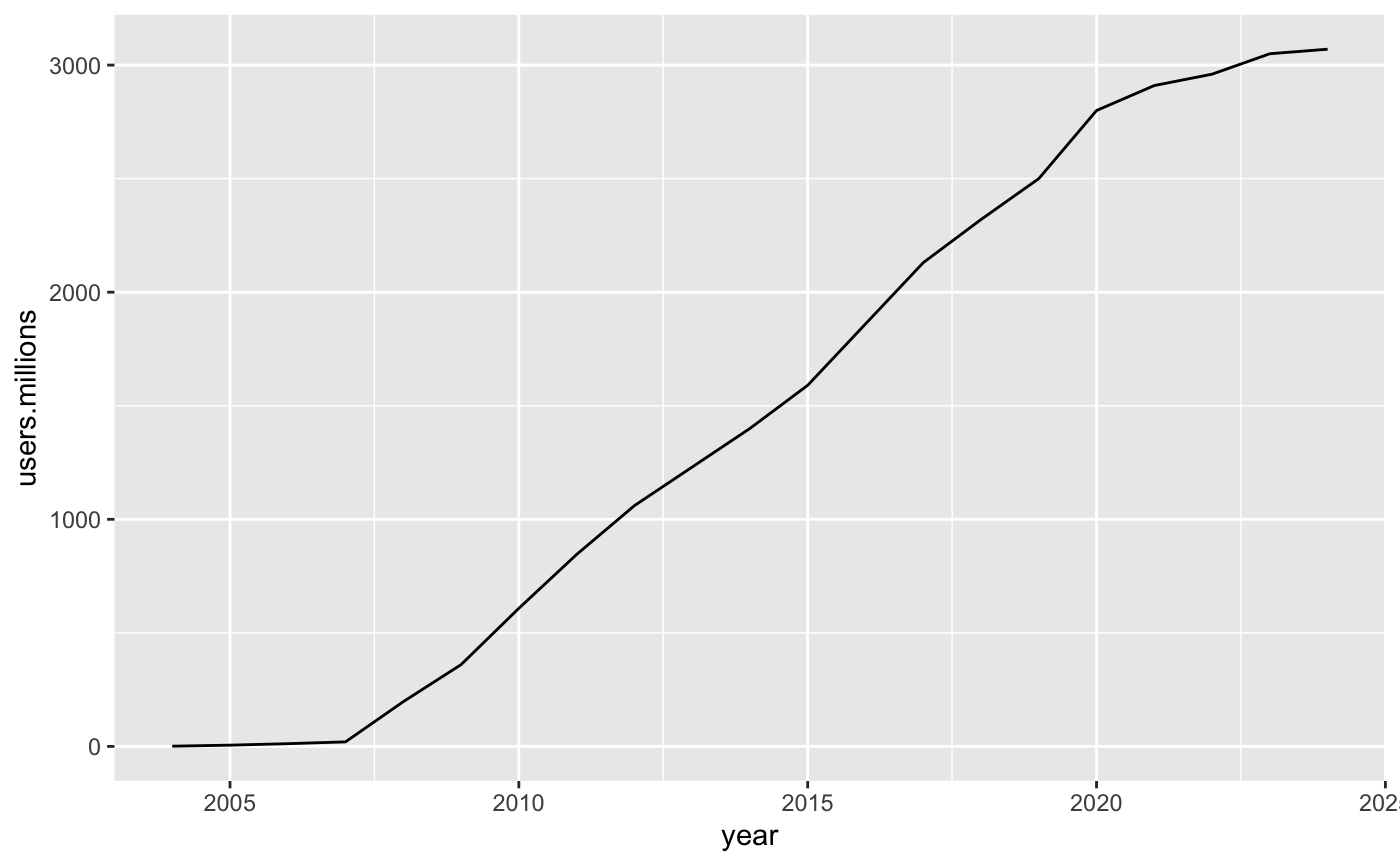
This chart shows us how the number of users of social media increased in the last 20-odd years. From close to 0 users to nearly half the earth’s population - that’s quite the growth story. However, this doesn't fully capture the story that needs to be told.
Think about it. Can we simply state that more people use social media today and end the conversation there?
A lot has changed since the early 2000s. We live in an era when we are almost always in front of a screen. Thanks to the proliferation of the internet, we are just a finger scan away from accessing our social media handles. An interesting side story to talk about here is how our screen time has increased in recent years.
As you would have expected, this data is not readily available. But the good news is, this can be pieced together from different places.
Part of the data is available at OurWorldinData, a very good source for other data as well and from Statista.
Once aggregated, we can do a simple line plot using our favorite grammar of graphics packages (that’s what gg in the ggplot means)
screen.time<- read.csv("screentime.csv") #loading screen time data

ggplot(screen.time, aes(x=year, y=total.time))+geom_line() #plotting the line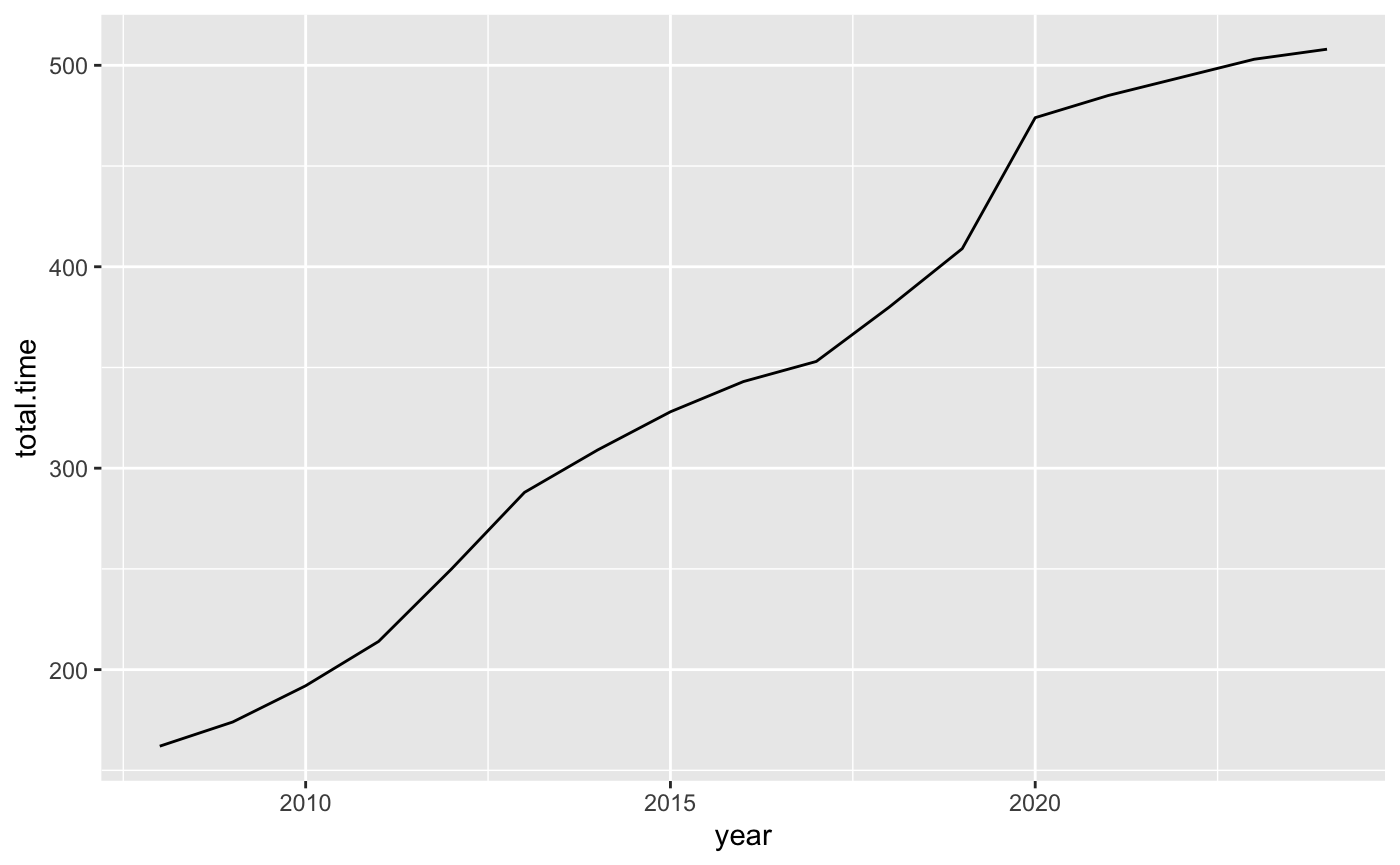
Voila! This looks almost similar in pattern to the other plot. In fact, if you were to keep them side by side, one may not be able to tell the difference.
Now, let’s try to do precisely that. Put them on the same plot. And just for fun, I’m going to make it look like the good folks at the Wall Street Journal made this chart.
scaling_factor <- max(combined_data$total.time) / max(combined_data$users.millions)

# Define colors for the Wall Street Journal style
wsj_blue <- "#4c72b0"
wsj_red <- "#c44e52"

ggplot(combined_data, aes(x=factor(year))) +
  geom_col(aes(y=total.time), fill=wsj_red) +
  geom_line(aes(y=users.millions * scaling_factor, group=1), colour=wsj_blue, size=1) +
  geom_point(aes(y=users.millions * scaling_factor), colour=wsj_blue) +
  scale_y_continuous(name="Average Daily Screen Time (mins)",
                     sec.axis = sec_axis(~./scaling_factor, name="Users (Millions)")) +
  theme_minimal() +
  theme(
    axis.text.x = element_text(angle = 45, hjust = 1),
    legend.position = "bottom",
    panel.grid.major = element_line(color = "grey80"),
    panel.grid.minor = element_blank(),
    plot.title = element_text(face = "bold"),
    axis.title.y = element_text(color = wsj_red),
    axis.title.y.right = element_text(color = wsj_blue),
    axis.text = element_text(color = "grey20"),
    legend.title = element_blank(),
    legend.background = element_blank(),
    legend.key = element_blank()
  ) +
  labs(
    x = NULL,
    y = NULL,
    title = "Users (Millions) and Daily Screen Time over the Years",
    subtitle = "A dual-axis chart comparing users in millions and total screen time in minutes."
  ) +
  guides(fill=guide_legend(override.aes = list(colour = wsj_red)),
         colour=guide_legend(override.aes = list(colour = wsj_blue))) +
  scale_fill_manual(values = c("Total Time" = wsj_red)) +
  scale_colour_manual(values = c("Users (Millions)" = wsj_blue))
Lo and behold, this is what we get!
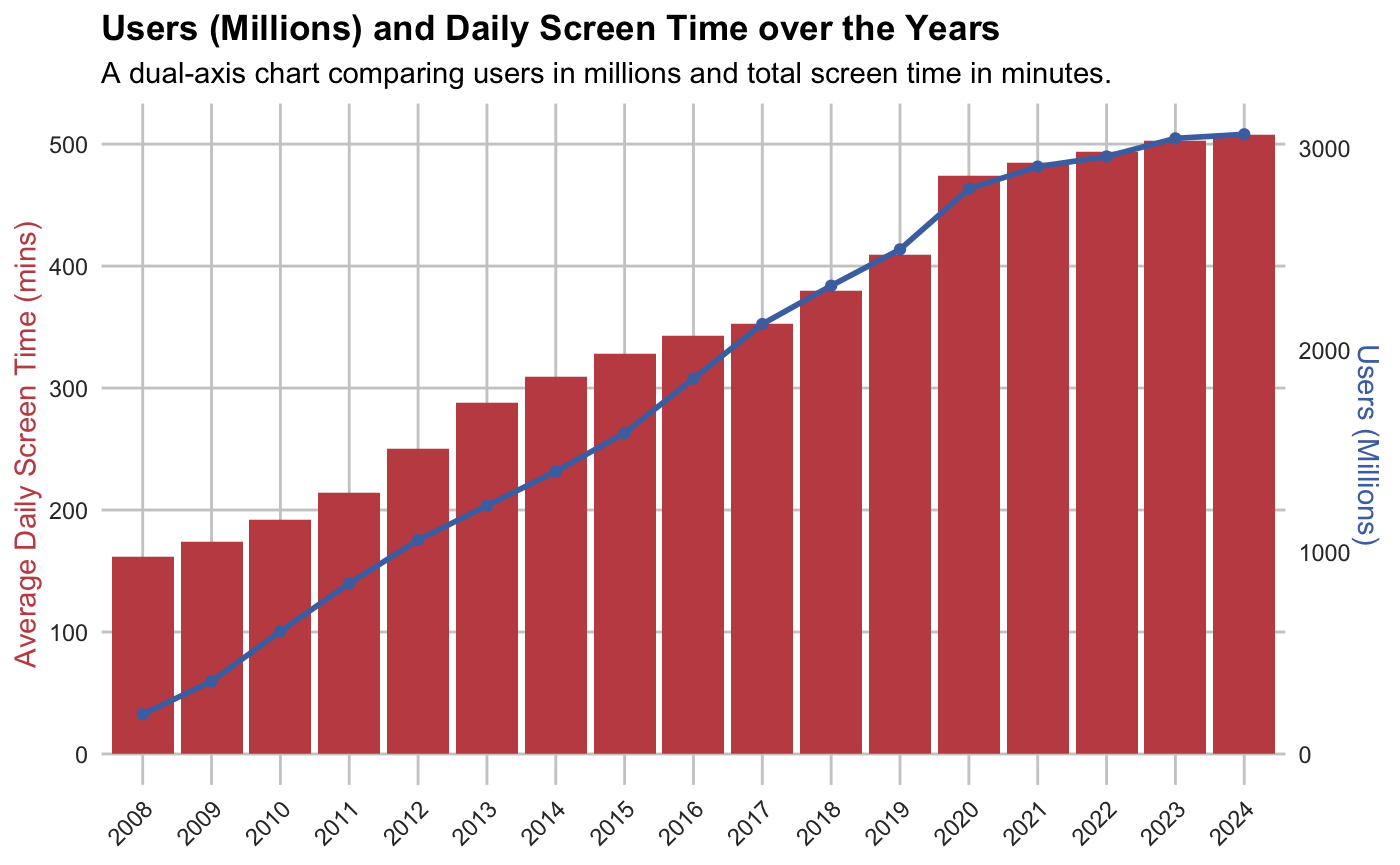
We could go as far as to say the only thing that’s keeping this from growing further is the sheer scarcity of people and time. Let’s take a moment to think about this.
What the data tells us is that there are not just more people using social media, but also (considering that most screen time is used on social media) we are spending more and more of that time (on average) in front of a screen.
This has led to an unprecedented integration of digital connectivity into our daily lives. The implications of this are vast and varied. On one hand, social media has fostered a new era of global communication, allowing people to connect across distances instantaneously. On the other, it has raised questions about the impact of screen time on our well-being, attention spans, and the quality of our real-world interactions.
As we mark two decades of Facebook and reflect on the broader social media landscape, it's clear that these platforms have reshaped how we communicate and spend our time. The data paints a picture of a world increasingly lived online, where virtual interactions are becoming as commonplace as face-to-face ones.
Looking ahead, the challenge will be to balance the undeniable benefits of connectivity with the need for meaningful engagement in the physical world. It's a narrative that will continue to evolve, and we—alongside our screens—will be the authors of the next chapters.
As we continue to chart this journey, let's stay mindful of our screen usage and strive for a harmony that fosters connection and personal well-being. After all, the richness of life lies not just in the breadth of our networks but in the depth of our real-world experiences. With that thought, we invite you to unplug after this read, look around, and connect in the wonderfully tangible world surrounding us.