
Gritty Graphs - Taxidynametrics
In this week’s episode of Gritty Graphs, we won't be diving into R code. Instead, we'll explore some ideas. As the placement chairperson at IIM Sirmaur, I thought it best to discuss placement statistics.
Human beings have a penchant for simplifying complex realities into singular figures. Consider how a country's Gross Domestic Product (GDP) is just one number. Yet, it informs us about potential recession statuses and influences Foreign Direct Investment (FDI) decisions, among other economic indicators. Similarly, in the realm of placements, one number often emerges as the most accurate descriptor of performance: the average Cost to Company (CTC).
Around this time last year, placement reports flooded the media. Numerous YouTube channels compared these average figures across IIMs and other premier B-schools. These discussions often revolved around the average CTC at various institutions, identifying patterns and attempting to systematise this information. I’ve coined a term for this analysis - Taxidynametrics, combining "Taxis" (Greek for arrangement or order), "Dynami" (for power, strength, or ability), and "Metros" (for measure).
(Note to self: This is what happens when you read too much of Asterix and Obelix in your childhood)
This year, with over 300,000 individuals having appeared for the CAT and the introduction of a new IIM in Mumbai, social media is likely buzzing with more discussions.
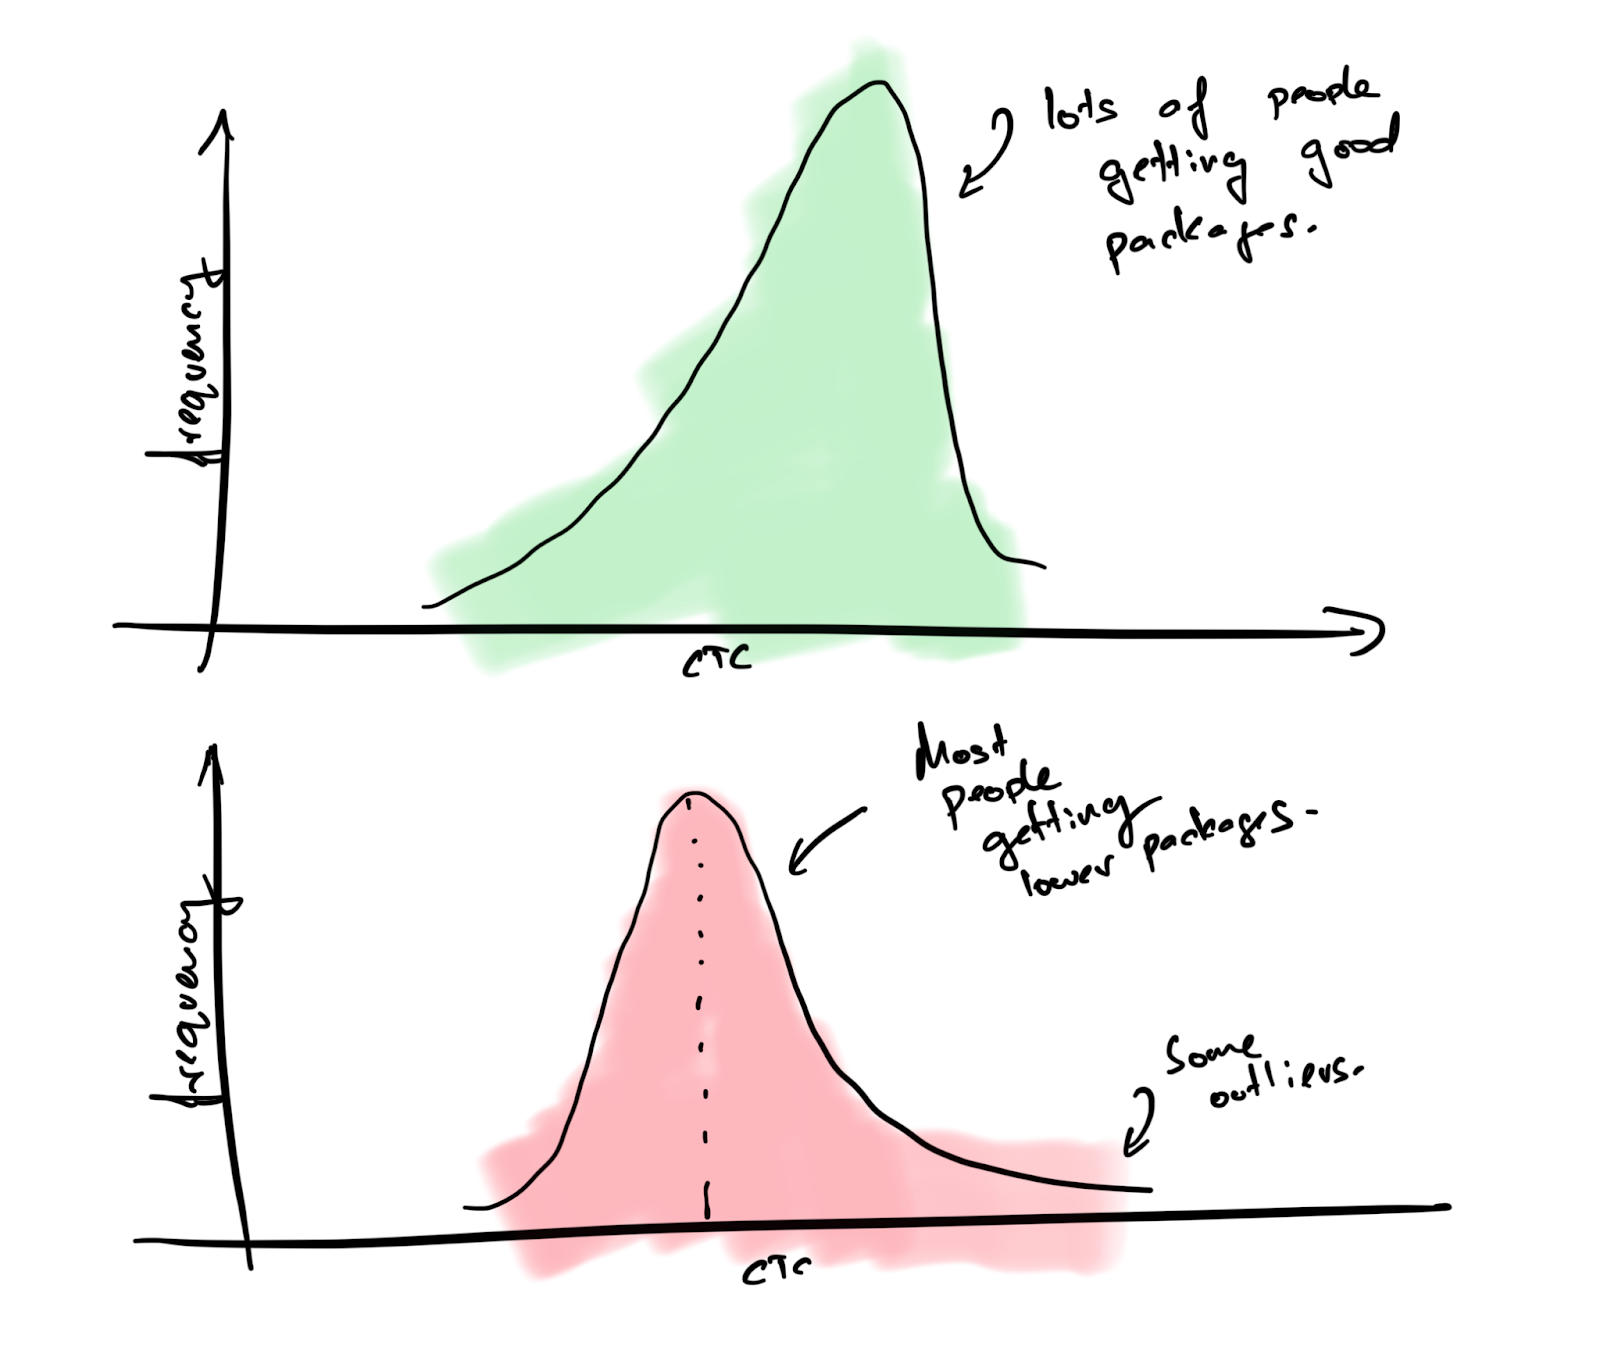
While comparing averages is straightforward, it's crucial to recognise the underlying assumptions in computing these averages. It's not enough to reach the means of two distributions directly. Although the averages might be similar, the distribution of values around the average can vary significantly. Let me explain further.
Imagine two scenarios where one B-school boasts an average CTC of, say, 20 lakhs while another reports the same. At first glance, both institutions seem to be on an equal footing, right? But, delve more deeply, and you might discover that the spread of CTCs at one school is much tighter, with most graduates clustering around that 20-lakh mark. Meanwhile, at the other school, the range is more comprehensive – some might be landing packages of 30 lakhs or more, while others are pulling in significantly less. This variance is crucial because it gives you a fuller picture of placement success beyond the surface-level average. I’ll try and show you what this looks like pictorially.
This is where our friend, Taxidynametrics , comes into play. It’s not just about the average figure that catches the eye; it's also about understanding the distribution behind that average. Are we looking at a tightly-knit success story, or is the tale one of wild disparities?
Adding more complication to this aspect is the issue of outliers. All you need to have is a few foreign offers at upwards of 60 Lakh to distort the figures fast. Think about it. In a batch of 300, just one person securing a 60 lakh package could skyrocket the average CTC in a manner that doesn't accurately reflect the reality for most of the batch. The median salary becomes an even more crucial metric than the average. Unlike the average, which a handful of outliers can significantly skew, the median salary tells us about the 'middle' earning potential, giving a more honest view of what most graduates can expect.
Confused? Let’s take this one step further and discuss another assumption. When comparing means, we assume the two institutes are actually comparable. In reality, this might not be the case. Every batch in every institute is different. In some institutes, there will be a more significant number of engineers compared to non-engineers. Typically, engineers do get paid more. Therefore, this can have a significant distortionary effect.
Similarly, experienced people are also likely to get more attractive packages. In reality, this should be seen as a fair demand since people do expect more money as compensation as they bring in more work experience to the table. This, too, can distort the figures by quite a bit. From my experience, most IIMs have not had a consistent record with the number of engineers/experience folks entering them.
This variability in the composition of each batch introduces yet another layer of complexity to our analysis. It's not just about the numbers themselves but also about who those numbers represent. For instance, the industry alignment of a batch could significantly impact average salaries. A batch with a higher proportion of students aiming for finance or consulting roles might naturally report higher average CTCs due to the industry standards, as opposed to those leaning towards sectors like education or social enterprises.
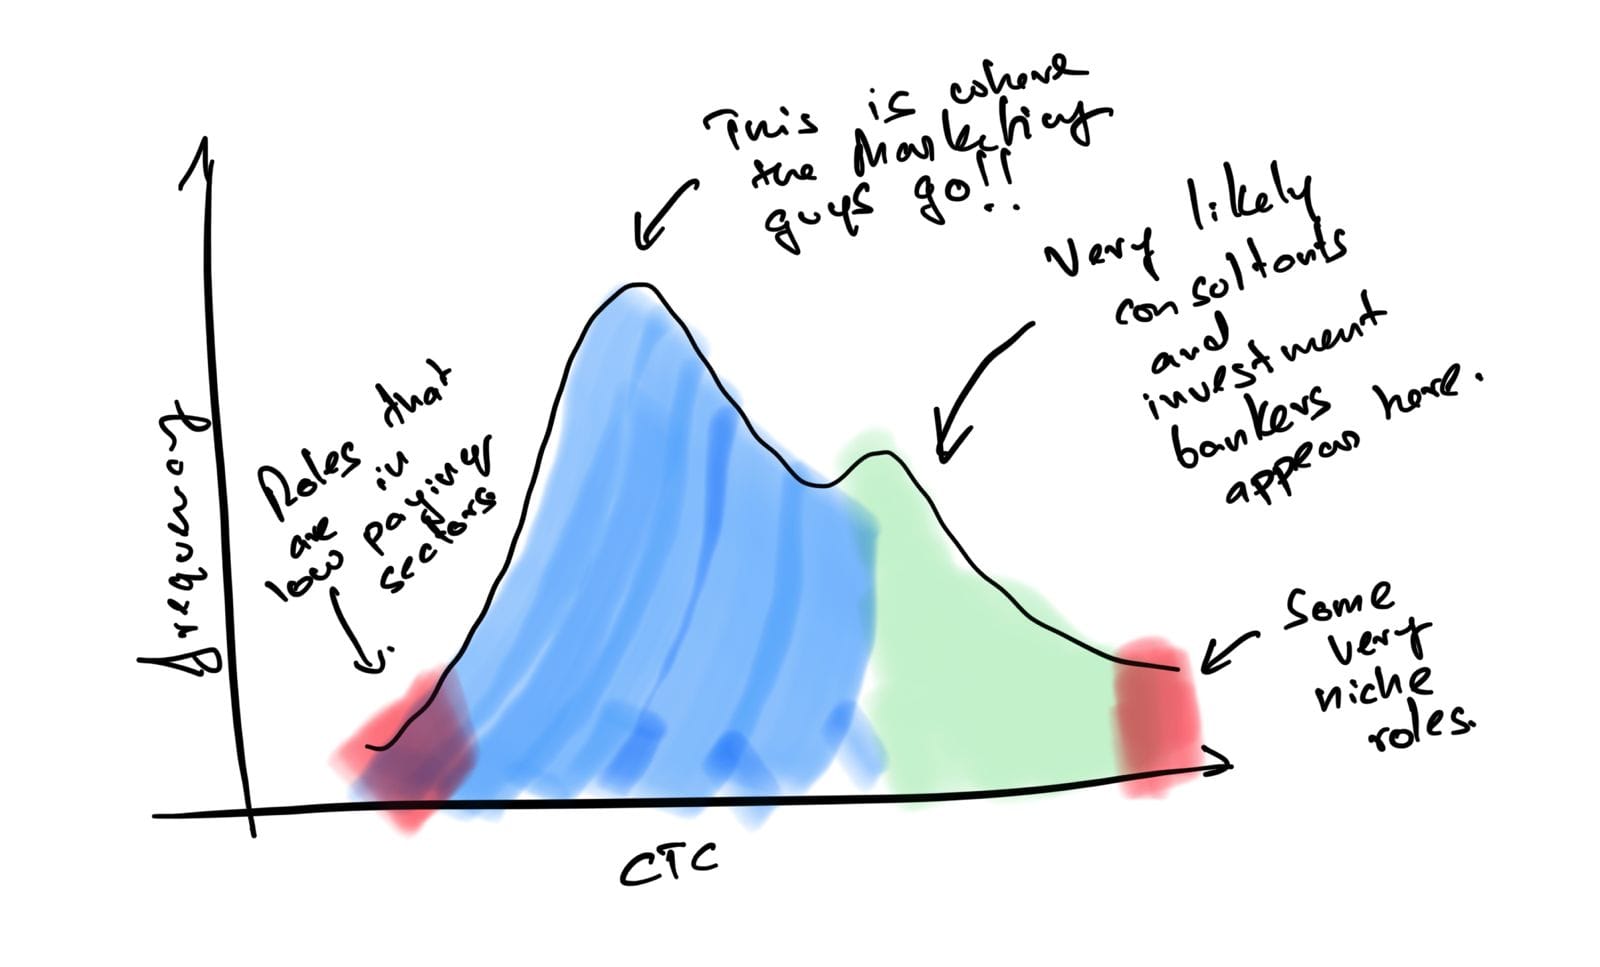
Furthermore, the geographical location of placements plays a crucial role. Offers from metropolitan areas or international locations often come with higher pay packages due to the cost of living adjustments and the global market rates. This geographical diversity in placements can further complicate direct comparisons between institutes.
What does this all mean for Taxidynametrics and, more importantly, for students and recruiters? It underscores the importance of a multi-dimensional approach to evaluating placement success. We must look beyond simple averages and medians to consider the distribution of salaries, the demographic and academic makeup of the batch, the industries and geographies of placements, and even the negotiation skills of the candidates themselves. For example, IIM Ahmedabad’s audited placement reports from last season show us how many offers have been provided across different sectors and functions (have a look at the chart found below).
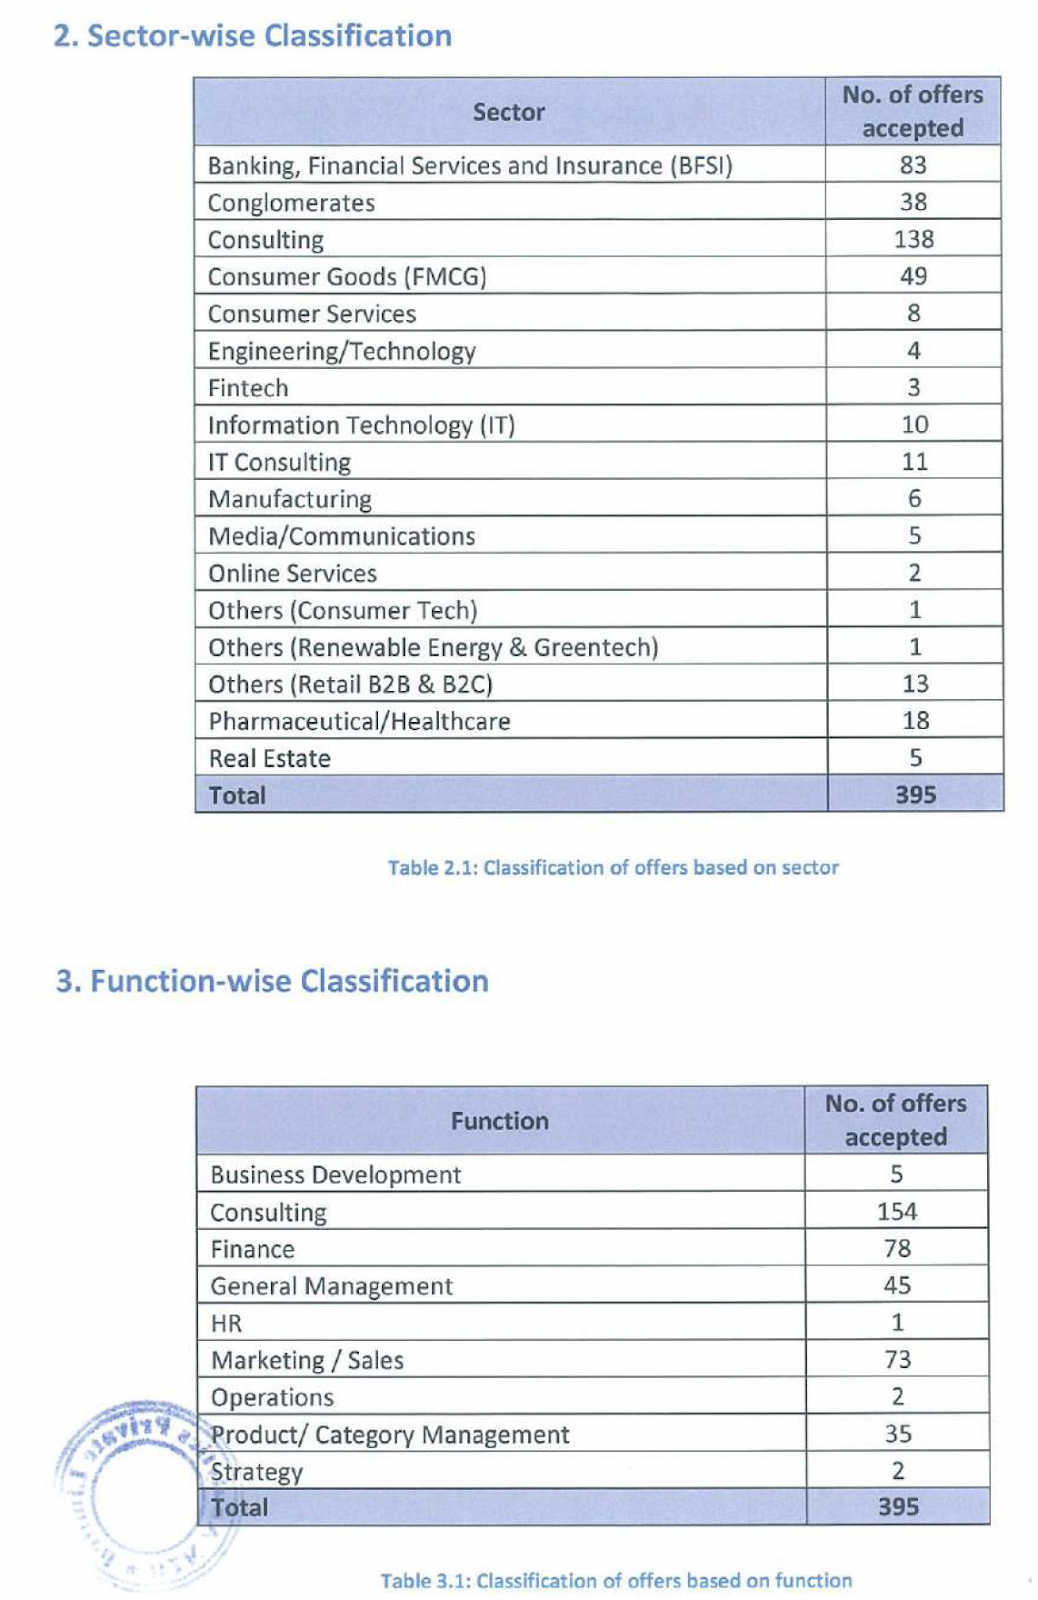
While this is excellent data presented to aspirants, it does not discuss some essential ideas they may want to explore before seeking admission. For instance, did the students who want to get into a specific function get into the same function? What is the average CTC in each of the functions? Some of these questions may be important for individuals to answer before making a life-altering decision.
But then, to truly understand and appreciate the placement performance of an institution, we need to dive into the softer details that cannot be easily communicated in the placement reports. To figure that out, one must analyse data from multiple angles and consider the broader context.
For instance, an institute's engagement with industries, alumni network strength, location, and even the soft skills training it provides can influence placement outcomes significantly. These are all factors you would like to consider before choosing where to study.
You may also want to find out about how the placement process functions and the culture that the institute has. The quality of the faculty, the nature of the inputs, the styles of teaching, the research outcomes, and how the learning environment is structured and influenced. Many of these cannot be measured by simple averages. You will have to delve into qualitative enquiry. A good place to start would be to ask students who studied there and discuss how things work in the institute. If possible, visit the campus, meet the key people there, and get a first-hand flavour of the place. There are too many aspects that a simple ‘average’ cannot capture.
In conclusion, the idea of ‘Taxidynametrics’ (that I simply cooked up) that the YouTubers are involved in might not help you understand the absolute reality that you may be experiencing on a campus. It’s critical that you realise that these numbers only paint a picture of the average, but in fact, there are many shades of not just grey but every colour on the palette. This should help us think critically and holistically. As we move forward, let's not just consume placement reports at face value but engage with them more deeply. Let's ask the right questions, seek out additional data, and, most importantly, remember that behind every statistic is a cohort of individuals with diverse aspirations, abilities, and potential. By looking beneath the surface and asking the right questions, one can ensure that our discussions and decisions around placements are as informed and efficient.