Session 7- Segmentation in Practice

Katanas
I’m sure most of you have already realised that I read and watch a lot of anime and fantasy. I have watched every episode of Dragon ball Z multiple times even before it was officially released in India. The same goes for Naruto, Pokémon, and a whole host of other shows (Rings of Power, House of the Dragon, Witcher, and the list goes on) that I am not very proud of. I also have read many of them in the Manga or book format and can tell you exactly where the show deviates from the books. All this means that my YouTube feed is filled with plenty of interesting video recommendations. For some reason, a video titled “Why Katana were hardly used by Samurai” showed up on my recommendations 2 weeks. You should watch it just in case you want to be on the same page as me.
When I watched the video, I was truly impressed. I honestly did not know this after having spent eons doing Samurai related stuff line playing Age of Empires, watching ‘The Last Samurai’, Naruto and Boruto, I thought I was an expert on the subject. Turns out, The Katanas were used only during dire times. This got me clicking away on Katana stuff and I found out that there was a ‘right’ way to hold the Katana. If one were to hold it wrongly, it was possible for them to lose their fingers (like literally). This inspired me! To be honest, the same holds for marketing research (and research in general). Given that all of us are smart. We tend to learn how to use techniques fast. We know our way around specifying regression models in the software packages of our choice, performing factor analysis, or doing ANOVAs. We also know how to interpret the results. But then, what we do not know is when to use them, and when not to.
Abe Lincoln, the 16th president of the USA, once said “If I only had an hour to chop down a tree, I would spend the first 45 minutes sharpening my axe.” Those are very wise words in my opinion. If we are to solve a research problem, most of the work needs to be done in thinking about how best to solve it. Not in the actual process of solving itself.
An experiment and its results
I thought, let me check if my students are more likely to be patient and think through things or run headstrong into the problem.
Given that there was very limited time for me to implement this, I tried to pick up a publicly available sales dataset and analyse that for a bit. I then thought of everything I would have done at 22 and wrote them down. I managed to plot charts for each of them and saved them to a PPT file (which I later used in class). My objective was simple. I wanted at least a few of your to identify that some of the assumptions that I was asking you to make were ridiculous and revolt.
When Monday arrived and the experiment finally occurred, the results were very pretty impressive. While no one questioned the ridiculous assumptions I was asking you to make, I was very happy to see all of you brainstorming on what the right approach could have been. Found below is the output of your hard work!
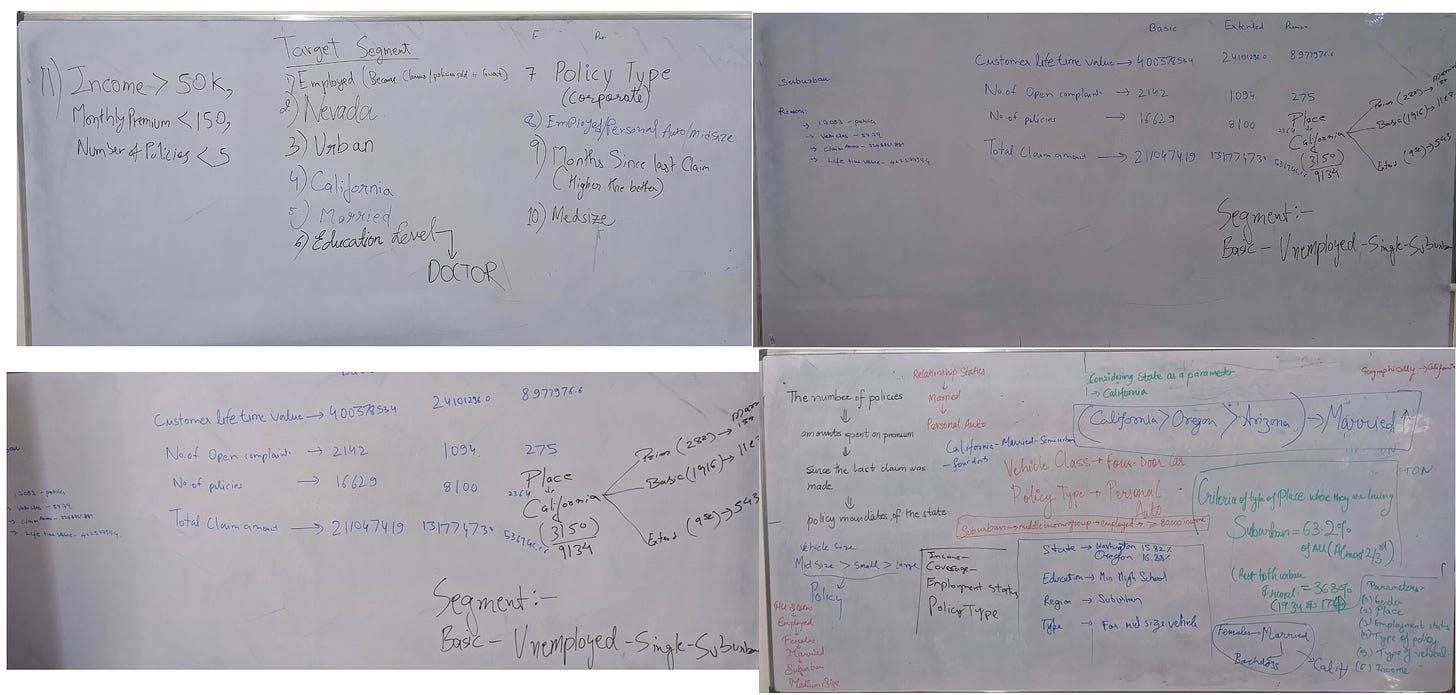
I had this my wallpaper for some time on Wednesday. And every time I saw it, I smiled. To be very honest, I was reminded of my college days when I would have behaved exactly the same way.
Basics of Market Research
Now, stories apart, marketing research is a pretty intense field that is filled with theory, technique and trial.
In the The Art & Science of Interpreting Market Research Evidence by D.V.L. Smith and J.H. Fletcher, the authors go on to describe some of the critical aspects of marketing research. They are:
- Analysing the right problem
- Understanding the big information picture
- Compensating for imperfect data
- Developing the analysis strategy
- Organizing the data
- Establishing the interpretation boundary
- Applying the knowledge filters
- Reframing the data
- Integrating the evidence and presenting research as a narrative
- Facilitating informed decision-making
We did touch upon each of them briefly in our class, but then, for those of you who are interested in exploring the wonders of research further, this may be a good starting point. So please do check it out!
There are some best practices that I think one should us when faced with the research problem (especially quantitative ones) .
First, think of the issue and identify the dependent and independent variables. Without this step, there is no going forward.
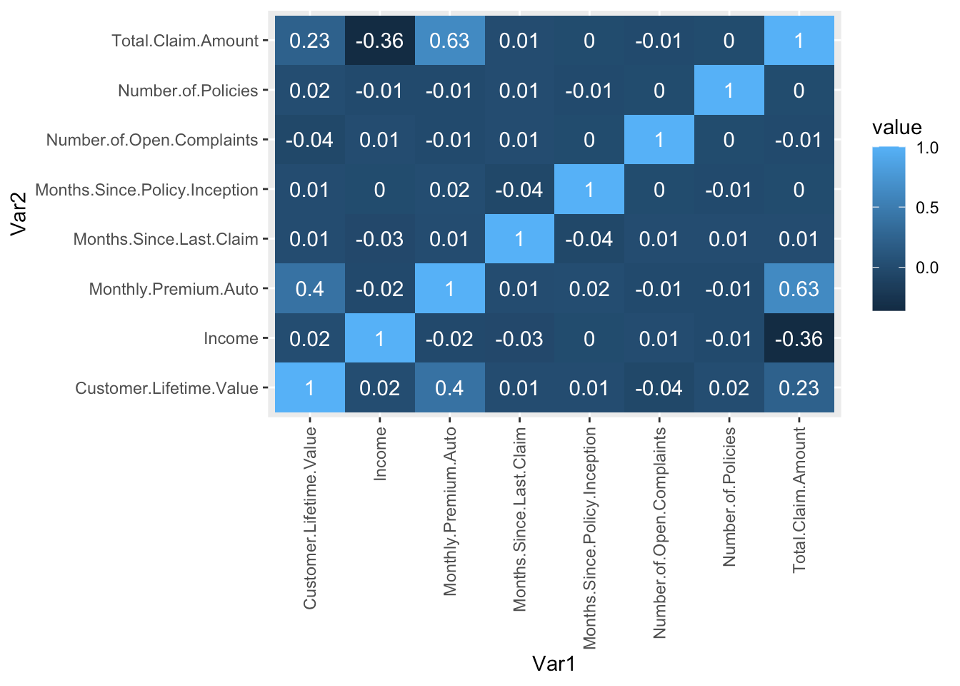
Second, plot a general correlation plot and see how the variables are related to each other. This is necessary background knowledge. In our case, total claim amount and monthly auto premiums were bound to be correlated because those who claimed more are (by definition) going to pay more. Note the the data does not really capture the time dimension.
You can generate the same using the following R code
library(correlationfunnel) #creating the correlational funnel
library(dplyr)
library (ggplot2)

data<- read.csv("AutoInsurance.csv")

data.numeric <- data %>% dplyr::select(where(is.numeric))
corr_mat <- round(cor(data.numeric),2) # creating correlation matrix
melted_corr_mat <- melt(corr_mat)

ggplot(data = melted_corr_mat, aes(x=Var1, y=Var2, fill=value)) +geom_tile()  + theme(axis.text.x = element_text(angle = 90, vjust = 0.5, hjust=1)) + geom_text(aes(label= value), color= 'white')
Third, a smart way to go forward is to use correlation funnel. The only issue with this approach is that you will have to decide which variable you are focussing your attention on. In our case, we could have looked at Churn or Coverage. Rest assured, there are going to be variables that you will be interested in taking control of in every case.
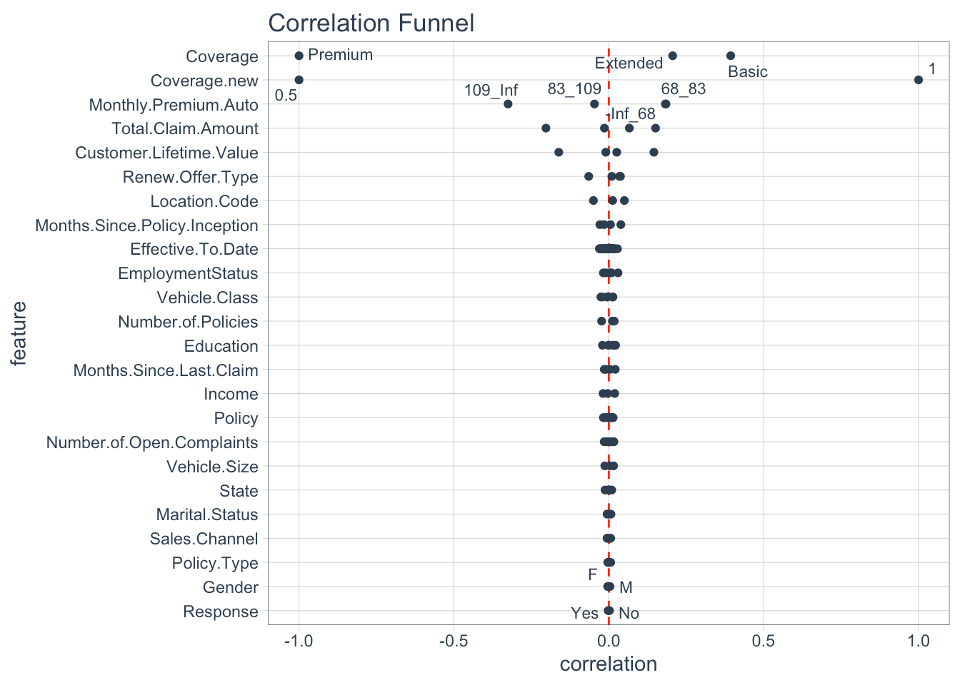
The following code can help you achieve this:
data_binarized <- data %>%
select(-Customer) %>%
binarize(n_bins = 4, thresh_infreq = 0.01) %>%
correlate(Response__Yes)
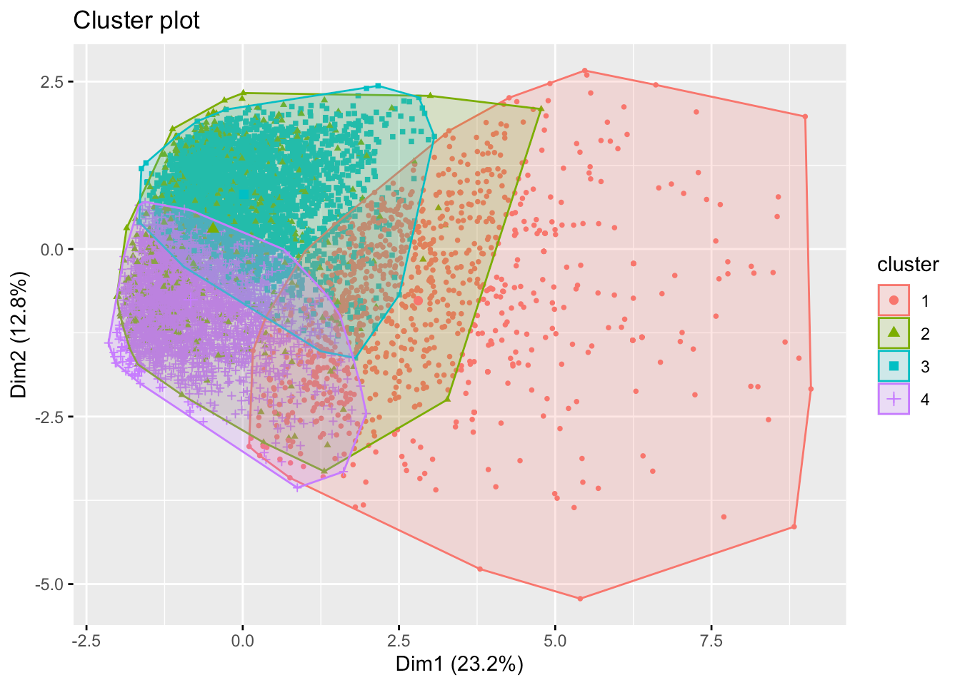
plot_correlation_funnel(data= data_binarized, interactive = FALSE)Forth, you can look for segments within the population. You can do that using clustering and generate plots like these:
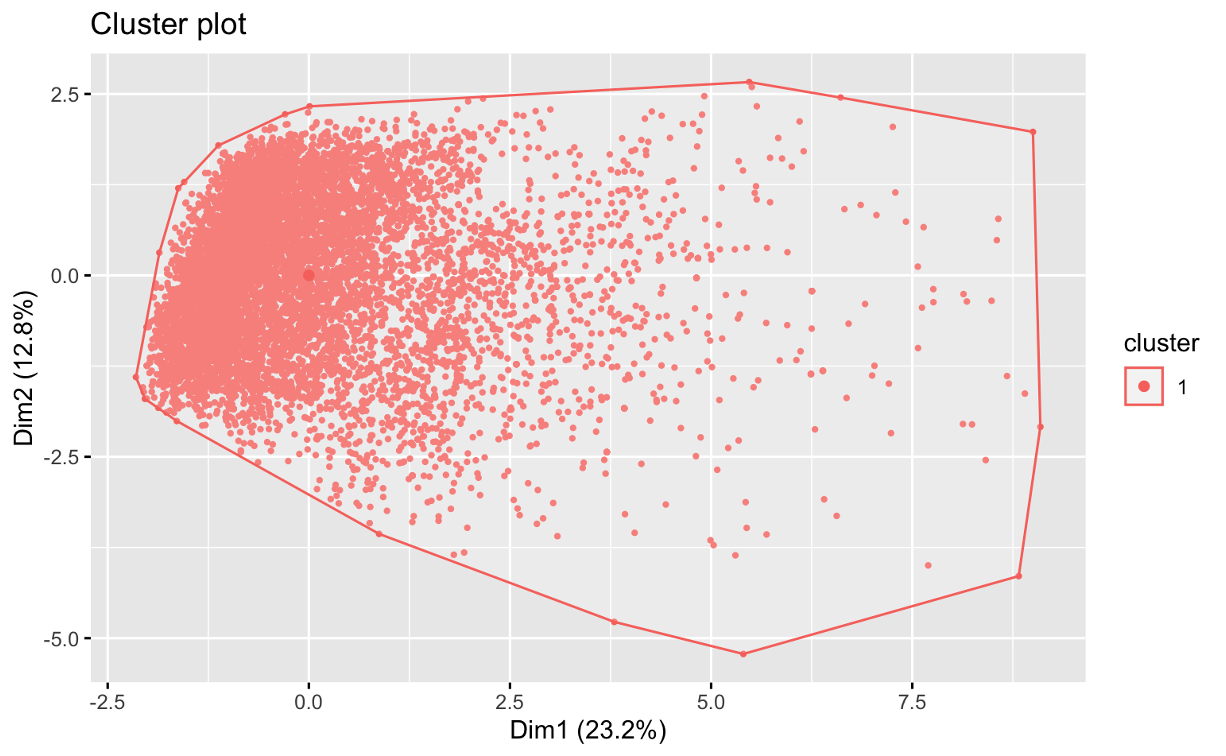
Or make Dendrograms.
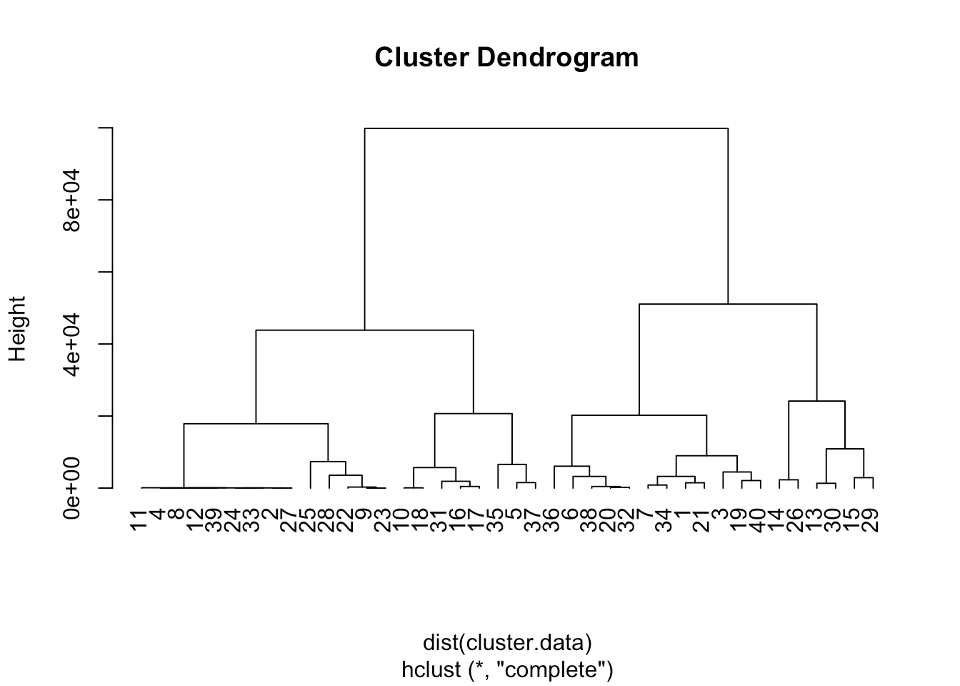
Ideally, both approaches lead to similar results.
Closing remarks
Remember, these are only the starting points of more detailed methods. While you may or many not implement these methods, rest assured in most organisations today, such research activities are routinely performed and the C Suite is constantly advised on how best to use the vast information they have to generate a sustainable competitive advantage in hyper competitive marketplace. Therefore, it may be a good idea to for all of you to learn how these analysis are created, and what assumptions go on in the background. Remember, challenge assumptions, whenever, and wherever necessary.