Sales Forecasting - Some Thoughts and Ideas
Introduction
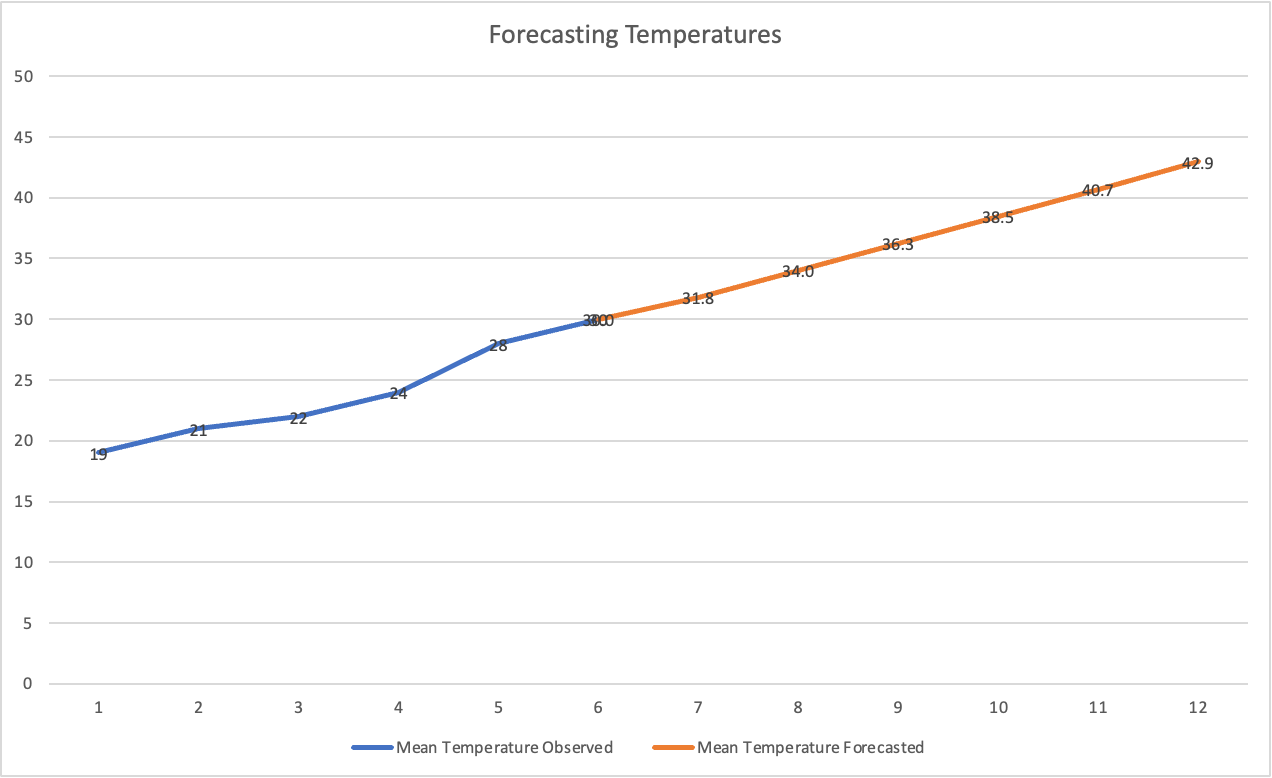
A few years back, while I was still a PhD Student, something interesting happened. I met an MBA student who began arguing with a professor. This was not an unusual occurrence on campus. This particular conversation however, was different. They were debating about the validity and use of the ‘FORECAST’ function in Microsoft Excel. To the student, the function was a data driven way of projecting what was expected to happen. To be honest, he had a point. MBA education in recent times has been emphasising on why managers should start making data driven decisions and not rely on impulses. What surprised me what what followed this. The professor quickly pulled the student’s computer towards him, and keyed in some text. He then turned the laptop around. Within those few keystrokes, the professor was able to generate a chart that looked something like the one found below. He then asked the student, “Do you think the mean temperature in December will his 42 degrees?”. There was silence. Many of the faculty members at IIM Calcutta who taught me have often remarked in class that they were only paid enough to ask questions, not answer them (This was, obviously, something professors did to make students think and not be served readymade answers).
There is no denying that forecasting is a critical technique that managers have to use from time to time. Over the last few decades, forecasting has seen phenomenal improvements, particularly in the realm of software. We now have forecasting software that do much more than just simply extrapolate. They analyse general trends, factor in a wide variety of additional inputs, and account for seasonality. Having said that, let me emphasise that forecasting is still a technique. A means to an end. An end the journey to which matters.
The fact that much of forecasting is shrouded in technical jargon often can and do (like in the case of that student) provide an illusion of being scientific. However, this may not be the case in reality. In fact, this may never be the case.
Forecasting is not a perfect science. It is more an art. Is always is and will be based on a wide variety of assumptions. For instance, forecasts implicitly assume that the trends that were observed in the past would continue into the future. Likewise, it also assumes that we know all the key variables that influence the forecasted variable. As you can see, this may not be the case in most real world applications. In the context of sales (which is the context of our discussion), we assume that market conditions will remain similar and consumer behaviour may not change too much. These assumptions are often inaccurate. That is why we get forecasts that do not hold water with the test of time. Pick up any industry forecast report from 2017 (5 years ago) and check, I can guarantee that the numbers will be off the mark by a significant degree (thanks in large part to the pandemic). Therefore, students should not just learn about the latest techniques to forecast, but must go beyond. Our interest here is not to debate about the best technique to forecast, but to try and understand the foundations of the idea, and recognise areas in which we must exercise caution.
The levels of the product
You are familiar with the idea of the three product layers. The three concentric circles from Philip Kotler. The core benefit, the actual product, and the augmented product. There may be several products that offer the same core benefit, but get packaged as different ‘actual’ products. For instance, a piece of paper and a copy of Microsoft Office both both offer the same core benefit - the ability to organize your thoughts and present it to someone. However, they are as different an actual product as you can imagine. Business owners, executives, and enthusiasts alike love to bucket Microsoft Office as an Office Suite and not bother with observing how other alternatives and substitutes evolve. This is precisely the idea that Theodore Levitt discusses in his seminal piece, Marketing Myopia. Levitt says it’s important to define what business you are in, and urges the reader to be as abstract as possible. He uses the example of the American railroad industry to showcase how defining the business narrowly may spell doom for its constituents. Now, put yourself in the shoes of the an American Railroad firm (the illustrative example Levitt uses in his article) and ask, how would you have forecasted your sales if you were at the helm of affairs back then. You may quickly recognise that it is not just the trends in your narrowly defined bucket (such as Office Suite) but also in other related buckets that begin to matter. I don’t think there is any data from the railroad industry back in the day that is available to us. However, I have something that is close. Have a look at the chart of American Records Industry sales below. The chart shows you how different ‘formats’ within the broadly defined ‘music’ industry have performed over the last 40+ years.
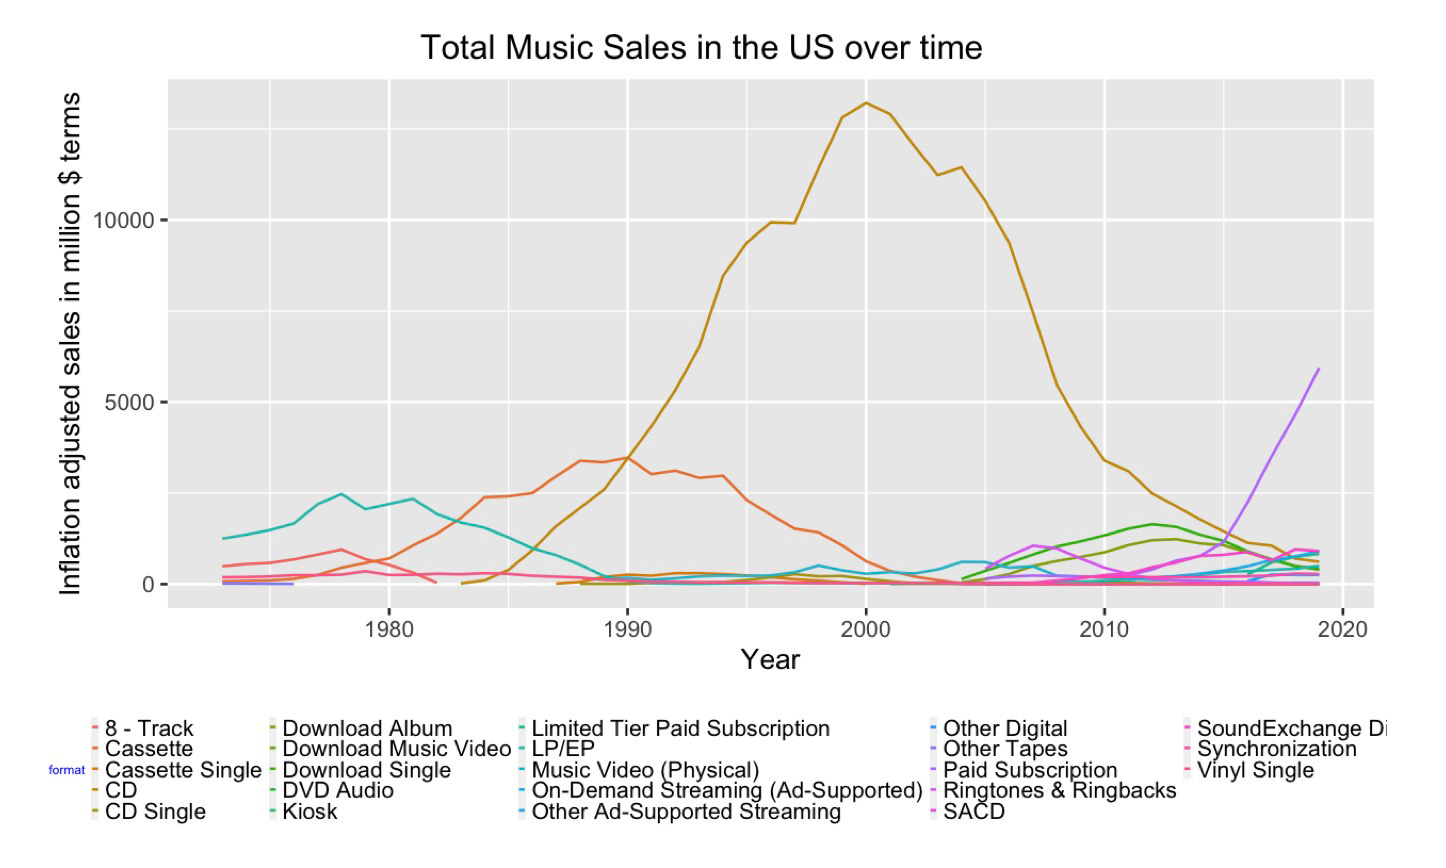
It looks like every format experience an slow introduction, rapid growth, plateau and quick fall. Now look at the the aggregated chart for the music industry.
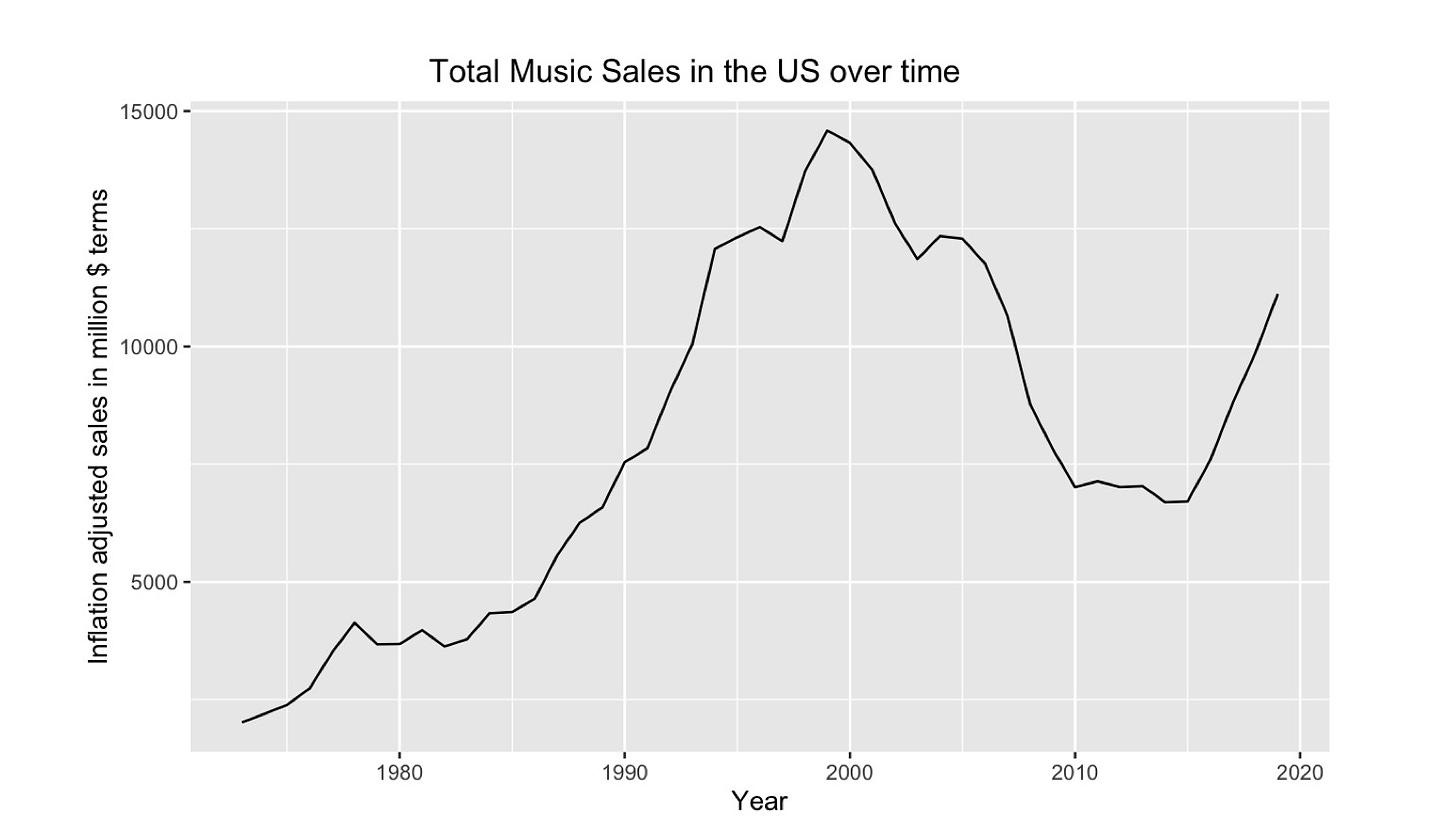
Do you think this makes more sense? Would you not agree that this provides a clearer picture of the sales made in the industry?
Does it offer a complete picture? Clearly no!
Why? Because ‘music’ is only one of the many entertainment choices we have and therefore, using data from gaming, movies, casinos, sports and others can possibly give us a clearer pictures. However, should we go ahead and use all that information when performing sales forecasts? Maybe not. But the exercise we just performed is useful in itself for two reasons.
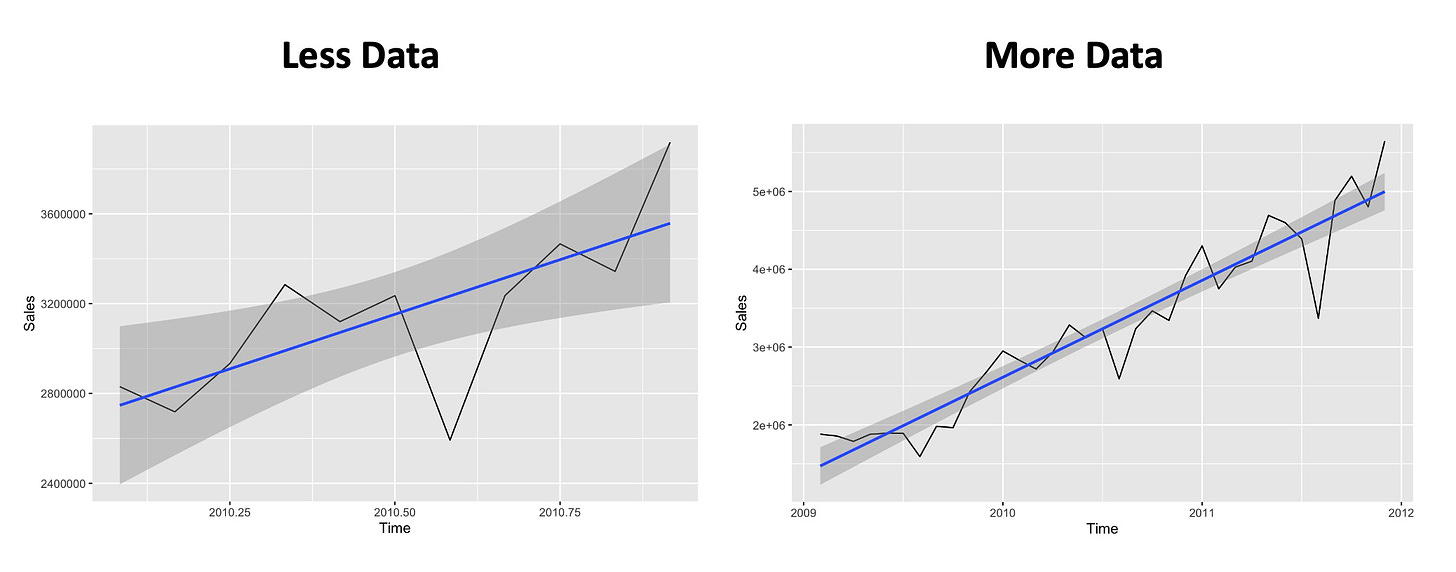
First, it helps us understand that more data helps us create better forecasts. In fact, simply using data from greater intervals of time can help us generate more accurate forecasts (see image below for illustration - I’ve use a different dataset to generate this).
Second, the exercise demonstrates that it is easier to forecast at the industry level than the firm level. Think about it, the sales that we observed from the Music Industry was for the entire industry, not just one firm. Getting a hold of that sort of information is somewhat challenging.
Sales and Demand are not the same thing
Very often, people use the terms ‘sales’ and ‘demand’ interchangeably. There is an issue with that line of thinking, and that is the second idea that I wanted to highlight.
Sales refer to the total amount of goods or services that businesses sell to customers. We measure it both in terms of volume and value. On the other hand, Demand refers to the desire or need for a particular product or service. Factors such as consumer income, consumer preferences, and the availability of substitutes influence. While there is a relationship between sales and demand, the terms cannot and should not be used interchangeable. In some cases, there may be demand for your good, but you may not be able to achieve any sales due to internal issues such as production and distribution. The opposite scenario is also equally likely. The question that needs to be asked then is, what exactly are we forecasting? Sales? or Demand?
Not all sales are made equal
This may sound obvious, but not all sales are equal. If I were to borrow a line from MIT professor Gary King (albeit in the context of sales), measuring sales is an exercise in boiling down a multidimensional construct into a single dimensional variable (He uses similar words to describe propensity score matching, a commonly used quasi experimental research technique). In simpler terms, you could make 100 Rupees by selling 10 packs of 10 Rupee biscuits, or one 100 Rupee pack of biscuits. Could you establish equivalence between the two? You could, but would you have a fair representation of reality? Perhaps not. The trick here is to understand that the sales numbers presented (both in terms of value and volume) are actually two parts of the same story. It may be mathematically possible to merge them together, but clearer insights can be gained by understanding the phenomenon in totality.
Concluding remarks
Sales forecasting can provide managers with a variety of benefits such as the ability to plan and budget, make data driven decisions, manage production more efficiently, handle risk more efficiently, communicate and take along various stakeholders (both internal and external), and allocate human resources more efficiently. However, it is simply a tool that can be misused. In the hands of someone who understands this, the tool can work wonders and change the way organizations function. However, in the hands of someone who does not understand the story behind the numbers, it could predict 43 degree celsius winter temperature. Remember, to a hammer, everything looks like a nail.