MM Session 13 - The Product Life Cycle
Introduction:
The PLC is one of the most misunderstood and abused tools in all of marketing and strategy. For instance, Turnbull and Meenaghan (1980) state that “the PLC concept views the process of market introduction from the point of view of the marketing company”. Obviously this is incorrect. According to the Levitt (1965) (one of the earliest papers to discuss the subject comprehensively), the PLC is drawn at the industry level.
If this is confusing, you are not alone. Kotler himself had to write “product (market offering)” in many places in his textbook to clarify what he’s talking about, especially in the context of the PLC.
Why is this the case?
The answer lies, perhaps, in the simplicity of the PLC concept. But before we explore that question, it may be useful for us to revisit what a product is.
What is a Product?
Product is one of those words that has found its way into the English lexicon. And therefore, it seems to have a wide variety of meanings. Simply put, a product is “is an object, or system, or service made available for consumer use as of the consumer demand; it is anything that can be offered to a market to satisfy the desire or need of a customer.” (Kotler et al., 2006). Typically, marketers consider every product to possess three levels.
- Core product
- Actual product, and
- Augmented product
(Note: In more recent books, this is shown to be five levels. )
In essence, there exists a core product/benefit/solution that customers are buying. However, the actual products may appear in a variety of shapes and sizes, and may be augmented by value added services that firms offer. In some way, it is this nuanced difference that is at the source of all misinterpretations.
In other words, one could draw a PLC for an entire product category (music), a product (cassettes) or a brand (Sony cassettes). Not all of them will look the same. Take a minute to quickly look at the RIAA dataset available here. Observe how for almost every product (format) you observe a very nice bell shaped curve.
The appearance of the bell shaped curve is not without reason. It’s natural that all things in nature to go through a natural progression of introduction, growth , maturity and decline. Products and services are no exception to this rule. But then, we will need to ask, do all products have a similar life?
The answer is a resounding ‘NO!’ .
Different life cycles:
This fact that different products have different PLC curves has been acknowledged by scholars. If you were to go and look at one the more recent text books of marketing, you may find something like this:
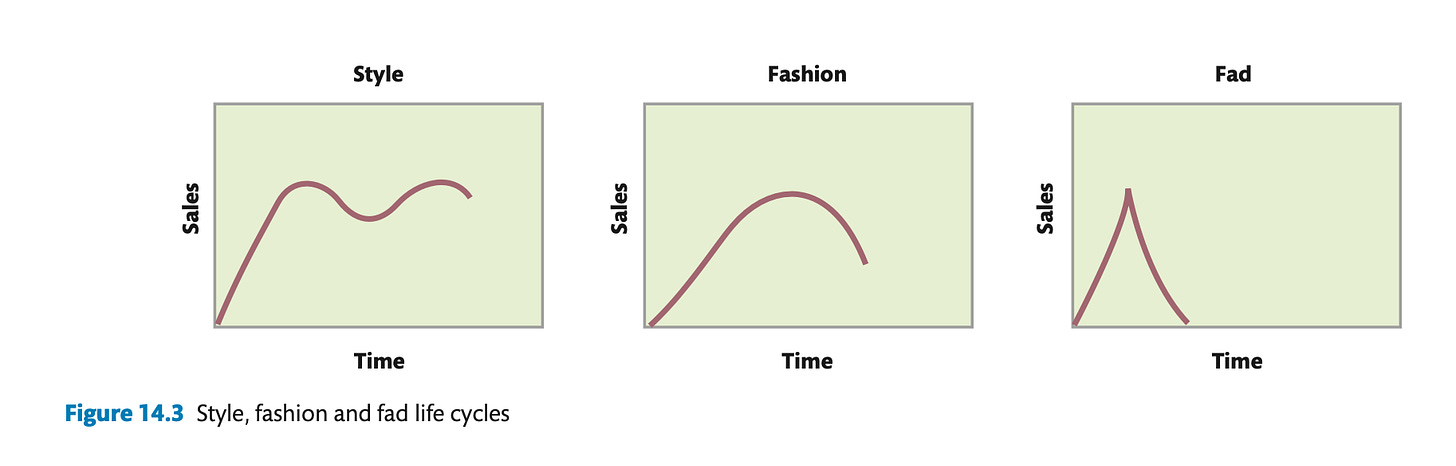
Clearly, these life cycles follow different paths. There can be a variety of other possibilities here as well.
There are many products (such as nylon that Levitt beautifully discusses in his 1965 piece) that may experience only growth for a long long time to come.
But then, how can it be possible?
Closing remarks
The trick is in understanding the Products, unlike naturally occurring organisms, can live on forever and can adapt to changing market environments. The creative energies of students like you can be used to find fresher pastures such as newer segments and uses for the products. This can re-invigorate the sales of your respective product offering and give it a fresh lease of life. It may be crazy to think of the PLC to be God’s word, and that it will eventually come to pass. It is simply a heuristic tool that helps marketers understand that products too can have phases. Marketers still have agency and can change the way the fortunes turn, for both good and bad.
Moreover, how can you draw the life cycle for a product that has not yet died? Perhaps you should think about it.
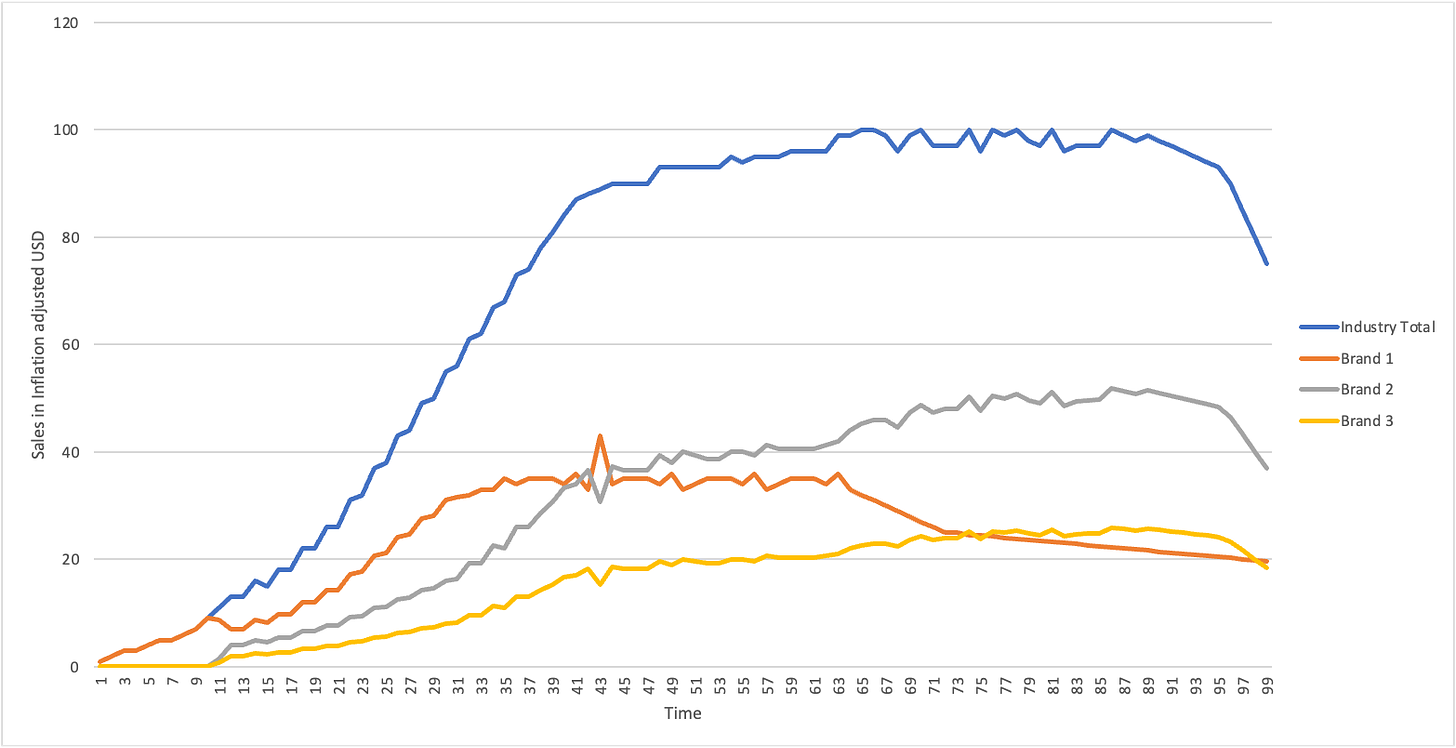
I am appending a simulated PLC plot to illustrate the crux of the class we had. Hope it helps you imagine the idea more clearly. Observe that there can be a lot of ‘action’ within the industry, but the overall industry typically follows a smooth, intro-growth-maturity-decline curve. When you look at PLCs later on in your career, it may be critical for you to ask at what level this has been drawn. And possibly, compare the curves drawn at different levels.
The aggregate version of the story can be seen more clearly in the RIAA data. For instance, look at the CD sales over time in the picture appended below.
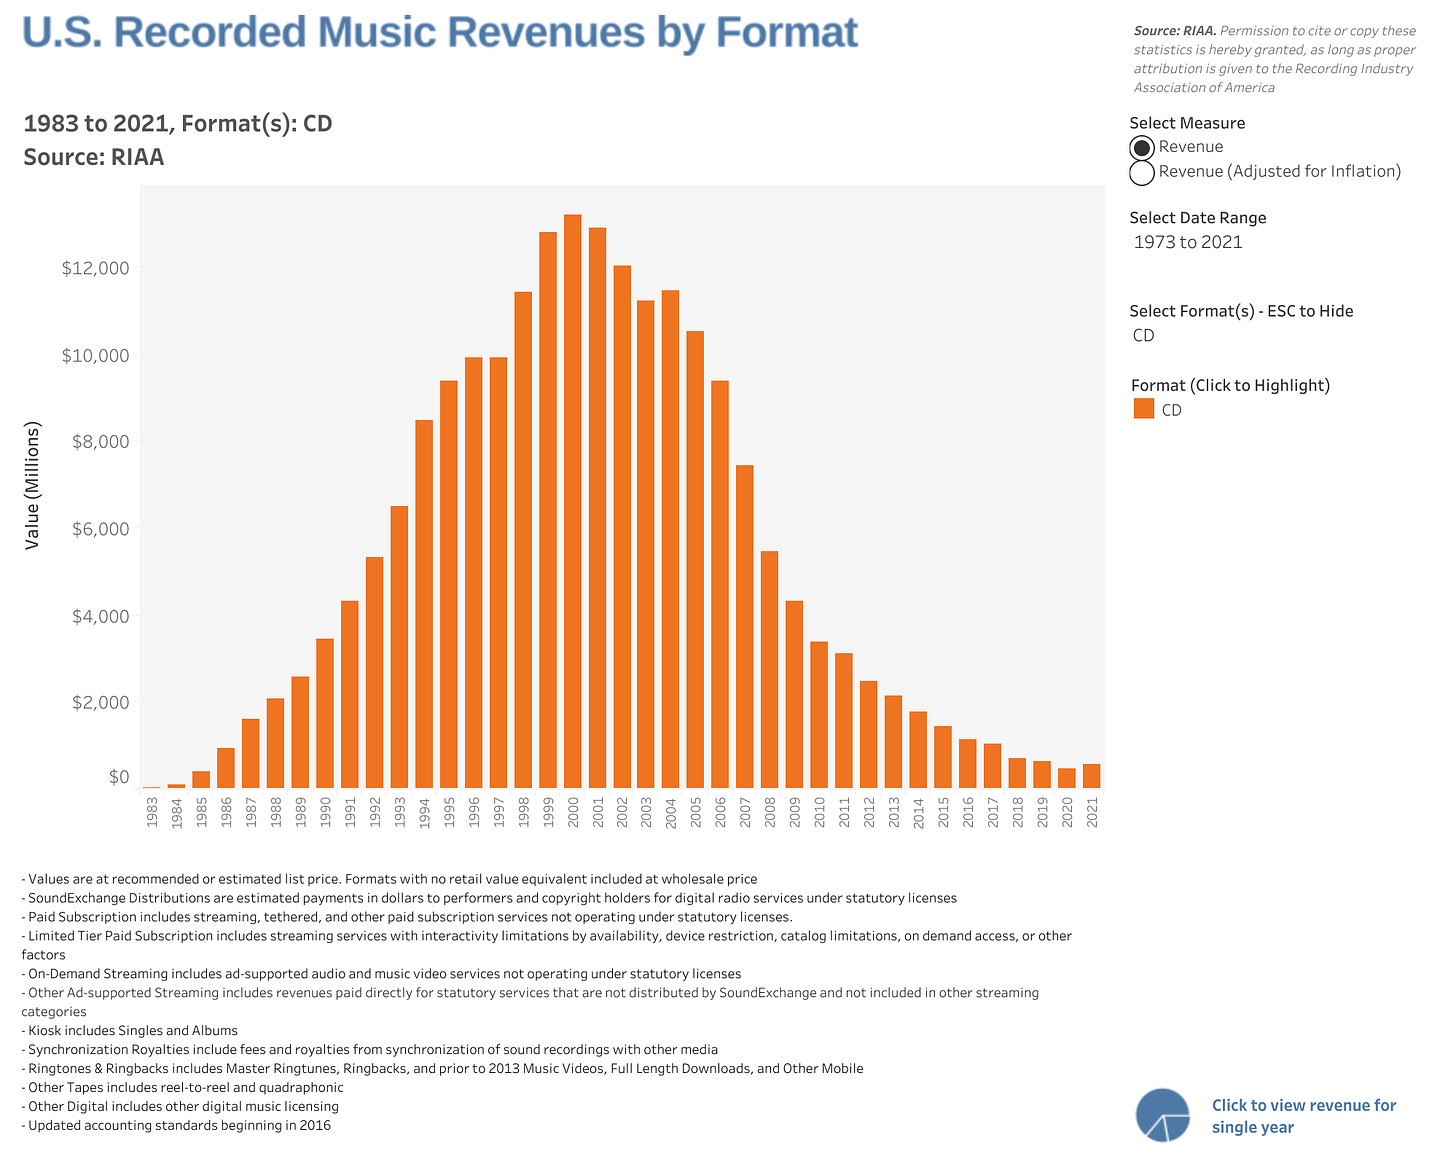
It may be useful to think of ways you can reinvigorate the CD sales. What kind of new uses can you think of for CDs? Are there segments in the market that may be interested in CD? Is there something creative that you can do to make things different?
Do have a look at the associated articles. We can revisit the ideas in the next class in case you have any questions.
Happy learning!!