CB - Notes and observations from Mid Term Presentations
Paving a way to better presentations - conceptually and visually
Over the course of the last two sessions, students of both sections completed the mid-course presentations. Congratulations!!
I felt every team put their best foot forward and worked on teasing out very interesting angles that added to the class learning. I could not gauge that this was the first time you presented on a real (offline) stage.
However, I thought I should put pen to paper and jot down some areas that offer significant scope for improvement. I am mainly focussing on (1) presentation skills and (2) conceptual clarity in this news letter. I also hope you will take it in the spirit with which it is written. Here goes!
I. Presentation tools
1. Make more beautiful slides
It’s always a good idea to create your own graphics for your presentations. You can do this using excel, R, Python or a host of other applications. In case you find the data available in a tabulated form, you may be able to use MS Excel’s handy ‘data from picture’ tool. You can learn more about it here. Do not copy paste tables, charts, and other figures directly from other sources. In the odd case that you want to use images from someplace, make sure you process the image to fit the slides. For instance, you may want to remove the background to make the image blend well. Let me illustrate with an example.
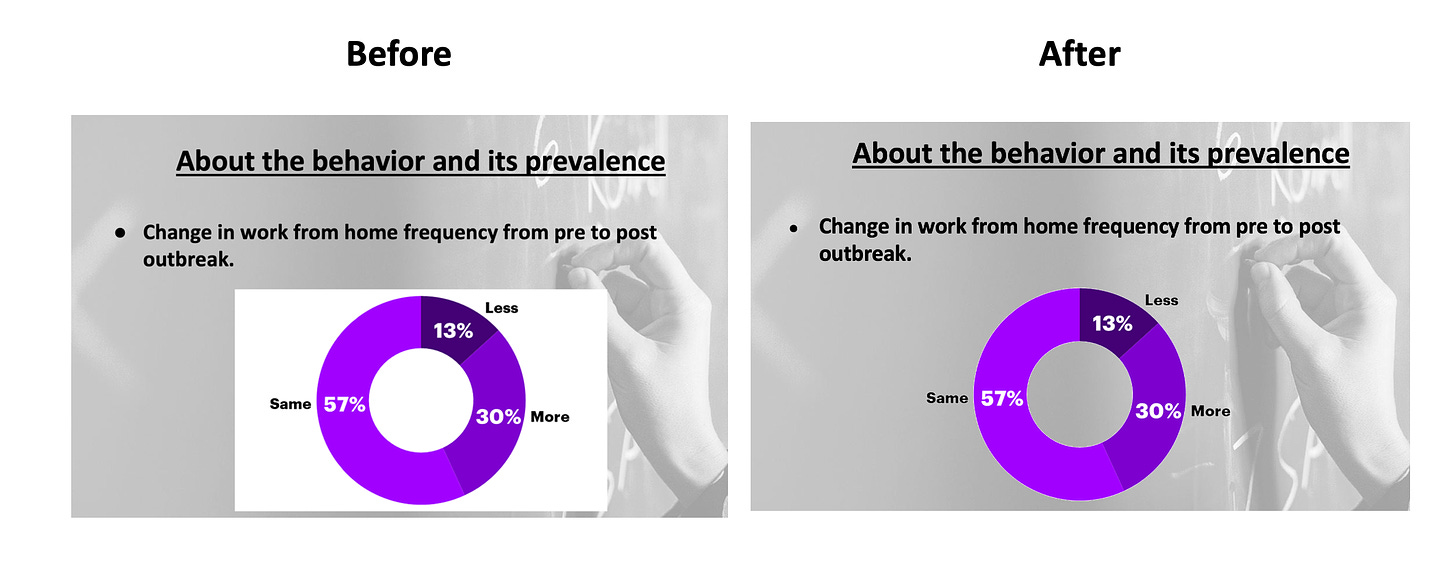
Observe the slides depicted above, the image to the left is from one of the slides you guys presented, and the one to the right is something I refined it to using an app called GIMP and its fuzzy select feature. You can learn how to do this here:
Other alternatives are to (1) use a slide colour that fits well with the image you are using and (2) generating the graphics yourself. How hard can it really be to create that pie chart on excel?
2. More is not necessarily good
I understand that you want to showcase how much of work that you have done for the project. For this reason, many of you had chosen to make many text filled slides. The issue with this approach is that it tends to distract the audiences, however motivated they are. Therefore, it may be a good approach to stick to 4 or 5 points in each slide. Preferably, you should also make use of bullets to categorise your points and focus your arguments. See the image below for a quick illustration.
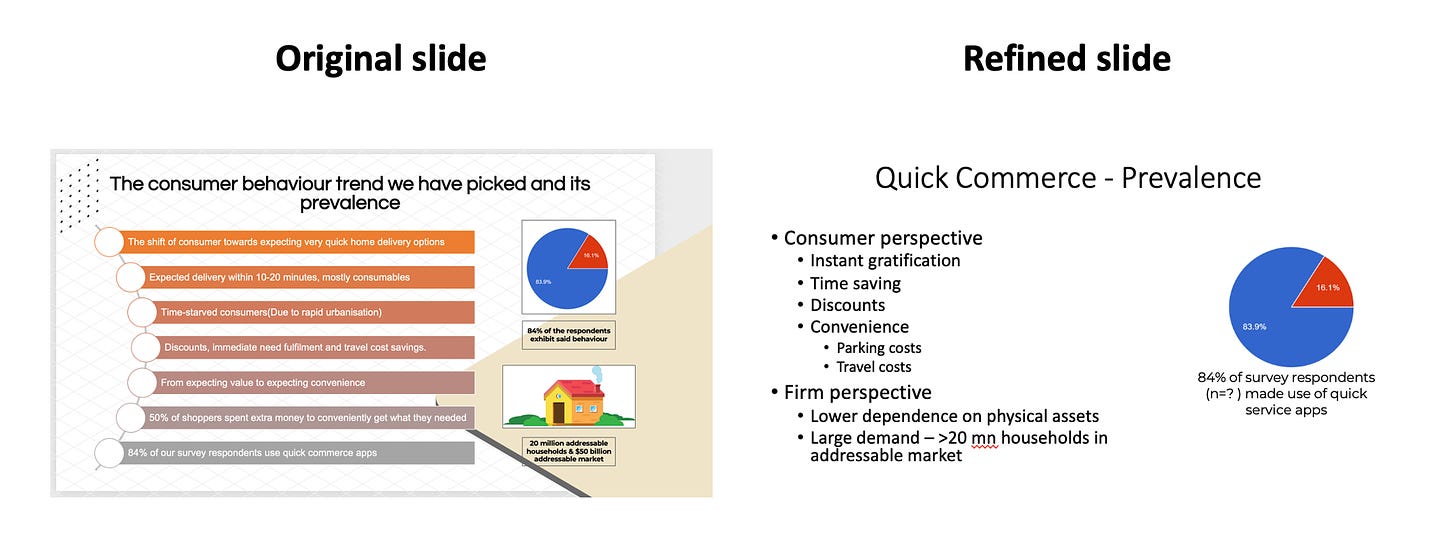
Which do you think is easier to read? It’s pretty much the same content.
The idea of any presentation to get an idea across to the audience. Make it easy for them to understand you. Also, use crisp and impactful titles.
3. Maintain uniformity
When you move from one slide to another, audiences may not be able to follow along if the font styles, sizes and colors keep changing. I understand that teams want to delegate tasks to individual members and collate the whole thing. But potpourris do not make for great presentations. You have to sit together and stitch together the slides to make it a less bumpy ride for the rest of us.
Also, please use font sizes that are easily readable from the last row in class.
4. Learn to cite properly
It is critical for young students to cite properly. Try and make use of the APA citation format when you cite articles and other resources from the internet. You can learn how to do that here. Software such as Mendeley make it easier for you to cite articles, keep track of them, and make and share annotations. You definitely won’t regret checking them out. You can also use them to store soft copies of the HBR cases you read all in one place (on the cloud).
5. Use good, high quality images
There are many sites that offer high quality, free to use images. One of my favourites is Unsplash. But there are many more too. You should try to use images from such sources whenever possible. In you are trying to show some flowcharts, you can quickly make them using powerpoint’s nifty ‘Smart Art’ feature.
We now move on to questions of a conceptual nature.
II. Conceptual clarity
I found that many presentations lacked depth in the subjects that were being presented. As discussed in class, the idea was to trace the behaviour and explain how a company can influence it. Let me demonstrate with an example that is close to me, Research shopping.
Research shopping is defined as “a way that shoppers search in one channel (i.e., online) and purchase in another channel” (Verhoef, Neslin, and Vroomen 2007). Given the proliferation of multi channel retailing in recent times, many consumers actually indulge in research shopping. Think about the phenomenon through the lens of the theory of planned behaviour.
First, what are the attitudes towards the behaviour? It may be fair to think some consumers may be positively predisposed towards exhibiting the behaviour (e.g. bargain hunters) while others are negatively predisposed (e.g. those who have had bad experiences due to research shopping in the past). Is there something that firms can do to improve this attitude? The answer is yes. Firms can put out communications through various channels to affirm that it’s ok for consumers to research shop (they may not want to do this in reality fearing backlash from incumbents. For a recent and related (sort of) example, check this).
Second, is the behaviour considered a subjective norm? Subjective norms are social pressures consumers faces when deciding how to behave. For many shopping goods some level of research shopping is general may be expected. However, many firms do influence the behaviour subtly. For instance, Apple stores generally price their products higher than co-located electronics retailers- by choice. Yet, millions of people choose to buy directly from Apple by paying a significant premium. Why? Do you think consumers would like to haggle in an Apple store for a discount? Apple has a brand so strong that people stand outside its stores to buy its the latest and greatest. This clearly shows how deep Apple understands it ‘fanboys’.
Last, is the perceived behavioural control. Here we ask, do consumers feel they can carry out the behaviour? Do they feel they have control over it? In the case of research shopping, consumers do have control over their behaviours. But then, firms can weaken or strengthen this perception. For instance, if a firm provides QR codes in physical stores to encourage online purchases, it may enable consumers to begin their ‘research’. This may in turn serve as the first step to research shopping.
The idea so far was to illustrate how one can create behavioural intentions. Is there a way to convert intentions to actions effectively? Can firms do something in this regard. This is where we apply a sense of scarcity, urgency, promotions, etc etc. They are basically the final nudge that begins the adoption of behaviours.
Here are some more quick pointers that I think may be of help:
- Do not conflate two or more ideas. Understand the boundaries of the concepts that you are talking about. For instance, understand that impulse buying and flash sales are very different from one another. It is true that there are some components that are shared, but you should not mistake one for the other.
- Use the correct definitions. Observe how I defined research shopping.
- Do not mix up correlation and causation. Over here, you will find a comprehensive discussion on the difference between the two ideas.
Closing remarks:
Here is an excerpt from The Psychology of Money: Timeless Lessons on Wealth, Greed, and Happiness by Morgan Housel. In the book, the author says,
“The amazing thing here is how big something can grow from a relatively small change in conditions. You start with a thin layer of snow left over from a cool summer that no one would think anything of and then, in a geological blink of an eye, the entire Earth is covered in miles-thick ice. ”
The MBA programme is perhaps the last structured opportunity for you to help compound and hone your skills. You should use these hours we spend together to learn from each others’ rights and wrongs. I am sure we will have many more interactions in the months, and perhaps years, to come. We will surely learn from one another in those months.
Happy Ganesh Chathurthi everyone! May lord Ganesha remove all obstacles from our courses (pun intended).
References:
Verhoef, Peter C., Scott A. Neslin and Björn Vroomen (2007), “Multichannel Customer Management: Understanding the Research-Shopper Phenomenon,” International Journal of Research in Marketing, 24 (2), 129–48.
P.S. I hope none of you take offence to the frank feedback and usage of parts of your slides for illustrative purposes. The intent here is constructive interference. We leave no one behind in Joka (and Paonta).