
Unpacking the NIRF B School data
A decade of NIRF data reveals that rankings are less about quality and more about whose priorities you’re measuring. To discover how ranks change with changing priorities, I built the B School Compass.
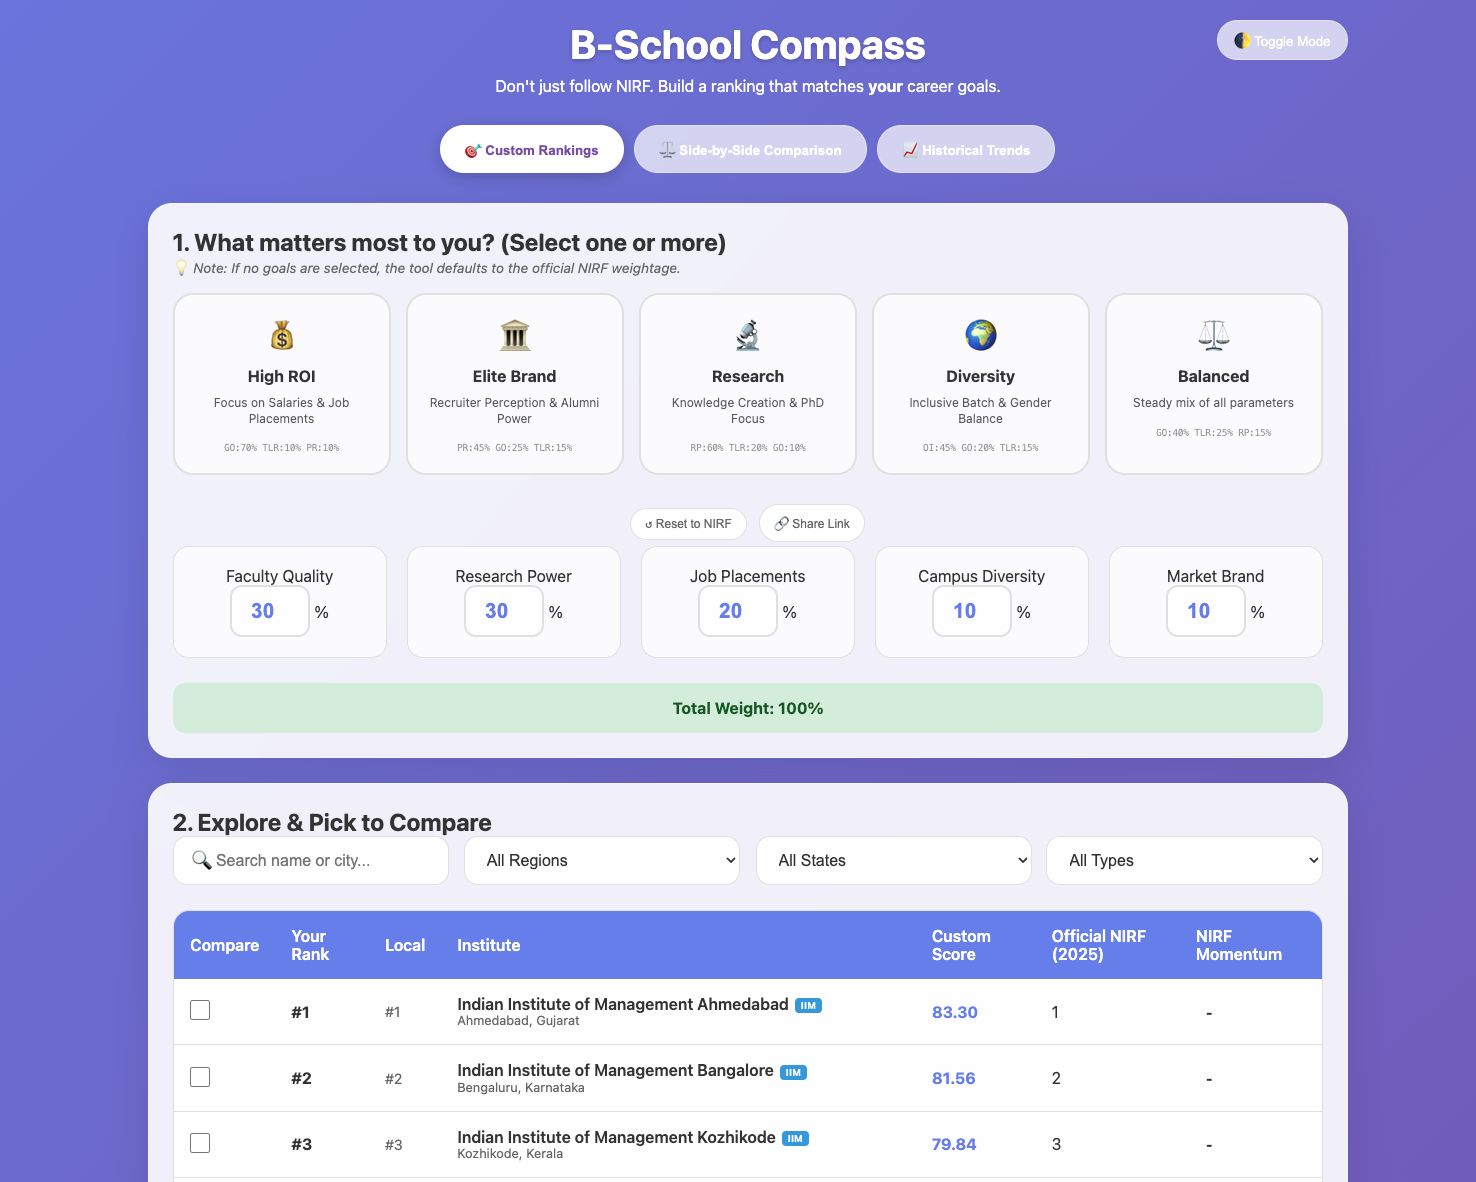
Try the B School Compass - Custom Ranking Tool
Introduction
Every April, when NIRF releases its management rankings, a familiar ritual unfolds across India.
Admit holders refresh the page obsessively. WhatsApp groups erupt with screenshots. Career counselors update their pitch decks. Parents forward articles with subject lines like “FINALLY some clarity!”
And somewhere, a student chooses Rank 47 over Rank 52, convinced that five ranks must mean something.
But what if I told you that the entire ranking could flip — dramatically — based on a single question:
What do you actually want from your MBA?
I spent the last few weeks analyzing 10 years of NIRF Management data (2016–2025), covering 776 institute-year observations. What I found challenges the way we think about B-school rankings.
The Weights We Never Question
Here’s something most MBA aspirants don’t know: NIRF doesn’t just count things. It weights them.
The formula:
| Parameter | Weight | What It Measures |
|---|---|---|
| Teaching, Learning & Resources (TLR) | 30% | Faculty ratios, PhDs, financial resources |
| Research & Professional Practice (RP) | 30% | Papers, citations, patents, consulting |
| Graduation Outcomes (GO) | 20% | Placement rates, salaries, higher studies |
| Outreach & Inclusivity (OI) | 10% | Gender, regional, economic diversity |
| Perception (PR) | 10% | Surveys of employers and academics |
Read that again.
Research output gets 30% of the weight. Placement outcomes — the reason most people pursue an MBA — get only 20%.
Is that wrong? Not necessarily. NIRF is measuring institutional quality holistically. Research output indicates faculty engagement, knowledge creation, and academic rigor.
But here’s the question: Is that what you’re optimizing for?
If you’re taking a 20-lakh loan to pivot your career, do you care more about your professor’s h-index or your median salary at graduation?
The answer varies by person. But the ranking doesn’t.
What Happens When You Change the Weights
To understand how sensitive rankings are to weight choices, I built a tool that lets you adjust the parameters yourself.
The results were striking.
The Placement Seeker (70% weight on Graduation Outcomes)
When I cranked up the placement weight to 70% and dropped research to 5%, the top 10 reshuffled significantly:
- IIM Mumbai jumps from #6 to #1 (highest GO score in the dataset)
- XLRI enters the top 5
- IIT Delhi drops from #4 to #15
- Several private institutes with strong placement records climb dramatically
This isn’t a criticism of IITs. Their management programs are research-oriented by design. But if you’re purely placement-focused, the “better” IIT program might actually be the worse choice for you.
The Brand Conscious (45% weight on Perception)
When perception dominates:
- IIM Bangalore overtakes IIM Ahmedabad for #1 (IIMB has a perfect 100 PR score)
- IIM Calcutta holds steady (strong perception)
- MDI Gurgaon drops from top 10 to #35
- Newer IIMs struggle despite strong fundamentals
Brand value is sticky. It takes decades to build and can’t be easily manufactured. If your career depends on name recognition (say, you’re planning to work internationally or in family business contexts), perception weight matters more than NIRF assumes.
The Diversity Advocate (45% weight on Outreach & Inclusivity)
When diversity becomes the priority:
- Jamia Millia Islamia enters the top 10
- IIM Shillong jumps significantly (strong OI scores)
- IRMA Anand climbs 15+ places
- Several metropolitan private institutes drop
If you believe diverse classrooms create better learning environments — and there’s substantial research supporting this — you might weight OI much higher than 10%.
The Institutes That Win Under Every Scenario
Some institutes are robust. They rank well regardless of how you weight the parameters.
IIM Ahmedabad, IIM Bangalore, and IIM Kozhikode remain in the top 5 under almost every weighting scheme I tested. Their scores are strong across all parameters — there’s no single weakness to exploit.
IIM Calcutta is interesting. It has the highest Graduation Outcomes score (99.09 in recent years) but relatively lower research output. It benefits when you weight placements, suffers when you weight research.
IIT Delhi is the mirror image — exceptional research, moderate placement outcomes. The “best” ranking for IIT Delhi depends entirely on what you value.
The Story Hidden in 10 Years of Data
Beyond the annual rankings, the longitudinal data tells its own story.
The Rise of IIM Kozhikode
In 2016, IIM Kozhikode was ranked #5. In 2025, it’s #3 — having overtaken IIM Calcutta and IIM Lucknow.
What changed? The component breakdown reveals:
| Parameter | 2016 | 2025 | Change |
|---|---|---|---|
| TLR | 79.5 | 87.8 | +8.3 |
| RP | 36.4 | 64.1 | +27.7 |
| GO | 89.5 | 95.4 | +5.9 |
| OI | 77.5 | 77.8 | +0.3 |
| PR | 49.9 | 74.3 | +24.4 |
IIMK’s research output nearly doubled. Its perception score jumped 24 points. This wasn’t luck — it was a strategic institutional focus on research and brand building.
The Decline of IIFT
The Indian Institute of Foreign Trade tells a different story.
| Year | Rank |
|---|---|
| 2018 | 23 |
| 2020 | 26 |
| 2022 | 24 |
| 2024 | 37 |
| 2025 | 17 |
IIFT has been volatile — dropping to 37, then recovering to 17. The swings are driven primarily by changes in TLR and research scores. For a specialized trade-focused institute, these fluctuations raise questions about measurement consistency.
The Curious Case of IIM Sirmaur
I’ll disclose upfront: I’m the Placement Chairperson at IIM Sirmaur. But the data tells an interesting story regardless.
IIM Sirmaur went from Rank 69 (2022) to Rank 51 (2025). An 18-rank improvement in 3 years.
The component breakdown:
| Parameter | 2022 | 2025 | Change |
|---|---|---|---|
| TLR | 57.7 | 74.1 | +16.4 |
| RP | 10.9 | 20.3 | +9.4 |
| GO | 83.1 | 83.9 | +0.8 |
| OI | 68.7 | 73.7 | +5.0 |
| PR | 23.9 | 16.0 | –7.9 |
Perception actually dropped. But teaching resources improved dramatically — more faculty, better infrastructure, stronger student-faculty ratios.
This creates an interesting paradox. If you only cared about brand perception, IIM Sirmaur got “worse.” If you cared about classroom experience and learning resources, it got significantly better.
Which story matters? That depends on you.
The Rank 50 Cliff
Perhaps the most striking finding in the data is what I call the “Rank 50 Cliff.”
When I analyzed placement outcomes (GO scores) across rank bands, a clear pattern emerged:
| Rank Band | Average GO Score |
|---|---|
| 1–10 | 94.2 |
| 11–25 | 89.7 |
| 26–50 | 85.1 |
| 51–75 | 72.3 |
| 76–100 | 68.5 |
The drop from Rank 26–50 to Rank 51–75 is not gradual. It’s a cliff.
Institutes ranked 51–75 often charge fees comparable to those ranked 26–50, but their placement outcomes are materially different. This is the danger zone — Tier–1 prices for Tier–2 outcomes.
If ROI is your primary concern, the Rank 50 cutoff matters more than the difference between Rank 35 and Rank 45.
Introducing the Tool
Theory is useful. But I wanted to make this actionable.
So I built an interactive tool that lets you:
1. Build Your Own Ranking
Adjust the weights for each parameter based on your priorities. See how the rankings change in real-time.
Are you placement-focused? Crank GO to 70%. Care about research? Boost RP to 60%. Brand-conscious? Weight PR at 45%.
The tool recalculates all 100 institutes instantly and shows you how the rankings shift.
2. Track Institutes Over Time
Select up to 5 institutes and see their ranking trajectories from 2016 to 2025.
You can view: - Official NIRF ranks over time - Custom-weighted scores over time (apply your weights to historical data) - Component breakdowns showing what drove rank changes
3. Compare Head-to-Head
Selecting multiple institutes? The tool generates a head-to-head comparison showing how they stack up on each parameter.
Deciding between IIM Lucknow and MDI? See exactly where each one excels and where it falls short — according to your priorities.
4. Export Your Results
Download your custom ranking as a CSV. Share your personalized top 10. Make decisions with data, not just brand recall.
What This Means for You
If you’re an MBA aspirant, the message is simple: don’t outsource your decision to a ranking.
Rankings are useful starting points. They aggregate information and provide a baseline. But they encode assumptions that may not match yours.
Before accepting a ranking at face value, ask: - What’s being measured? - How is it weighted? - Does that weighting match my priorities?
An ROI-focused student and a research-focused student should not have the same ranking in their heads. Yet most do, because NIRF is the only one they’ve seen.
The Bigger Picture
This isn’t about NIRF being wrong. The methodology is transparent, the data is public, and the intentions are sound.
But any ranking that claims to identify the “best” is making a philosophical claim about what “best” means. NIRF’s definition of best involves research productivity, perception surveys, and diversity metrics — alongside placements.
That’s a reasonable definition. It’s just not the only one.
The student from a Tier–2 city, first in their family to pursue an MBA, taking a loan they’ll spend years repaying — their definition of “best” might be quite different.
This tool is my attempt to make that visible.
Methodology Notes
For those interested in the details:
- Data source: NIRF Management Rankings 2016–2025, scraped from official NIRF portal
- Coverage: 776 institute-year observations across 10 years
- Institutes tracked: 192 unique institutes (many appear in multiple years)
- Component scores: TLR, RP, GO, OI, PR as reported by NIRF
- Tool: Custom-built calculator that normalizes user-defined weights and recalculates scores
The raw data and methodology are available for verification. Transparency matters.
A Final Thought
Every ranking is an opinion expressed as math.
NIRF’s opinion is thoughtful and well-constructed. But it remains an opinion — about what makes an educational institution valuable, about how to weight competing priorities, about what “quality” means.
Your opinion might be different. And that’s okay.
The tool I’ve built won’t tell you which B-school is best. But it might help you figure out which one is best for you.
That seems like a more useful question anyway.
Dr. Karthikeyan Balakumar is the Placement Chairperson at IIM Sirmaur. The views expressed here are personal and do not represent his institution. The analysis uses publicly available NIRF data.
If you found this analysis useful, you might also enjoy my earlier piece on the ABDC journal list, which applies similar thinking to academic publishing.