
The ABDC Journal List Looks Like It’s Getting More Elite. The Data Tells a More Complicated Story.
An analysis of 15 years of ABDC journal quality list data (2010–2025), tracking every journal across six review cycles.
In business schools around the world, one list quietly shapes careers. It influences who gets hired, who gets promoted, and which research gets funded.
It’s the ABDC journal quality list — a ranking of roughly 2,700 business journals into four tiers: A* (elite), A, B, and C. Maintained by the Australian Business Deans Council, it’s reviewed every three years. Where your paper lands on this list can matter as much as what’s in it.
I pulled every publicly available version of the list — 2010, 2013, 2016, 2019, 2022, and the 2025 draft — and tracked what actually happened inside the numbers.
The headline story is simple: more A* journals, fewer C journals, a list that looks increasingly selective. But when you track individual journals across cycles, the picture gets more complicated. What looks like quality rising at the aggregate level turns out to be two very different forces at work — one at the top, another at the bottom.
The basics: a stable list with a shifting interior
The total number of journals on the ABDC list has barely changed in 15 years:
| Year | Total journals |
|---|---|
| 2010 | 2,661 |
| 2013 | 2,765 |
| 2016 | 2,776 |
| 2019 | 2,679 |
| 2022 | 2,680 |
| 2025 (draft) | 2,659 |
The 2025 figure excludes 141 journals the draft proposes for removal — more on those later.
The list hovers around 2,700. But the composition inside that number has shifted dramatically.
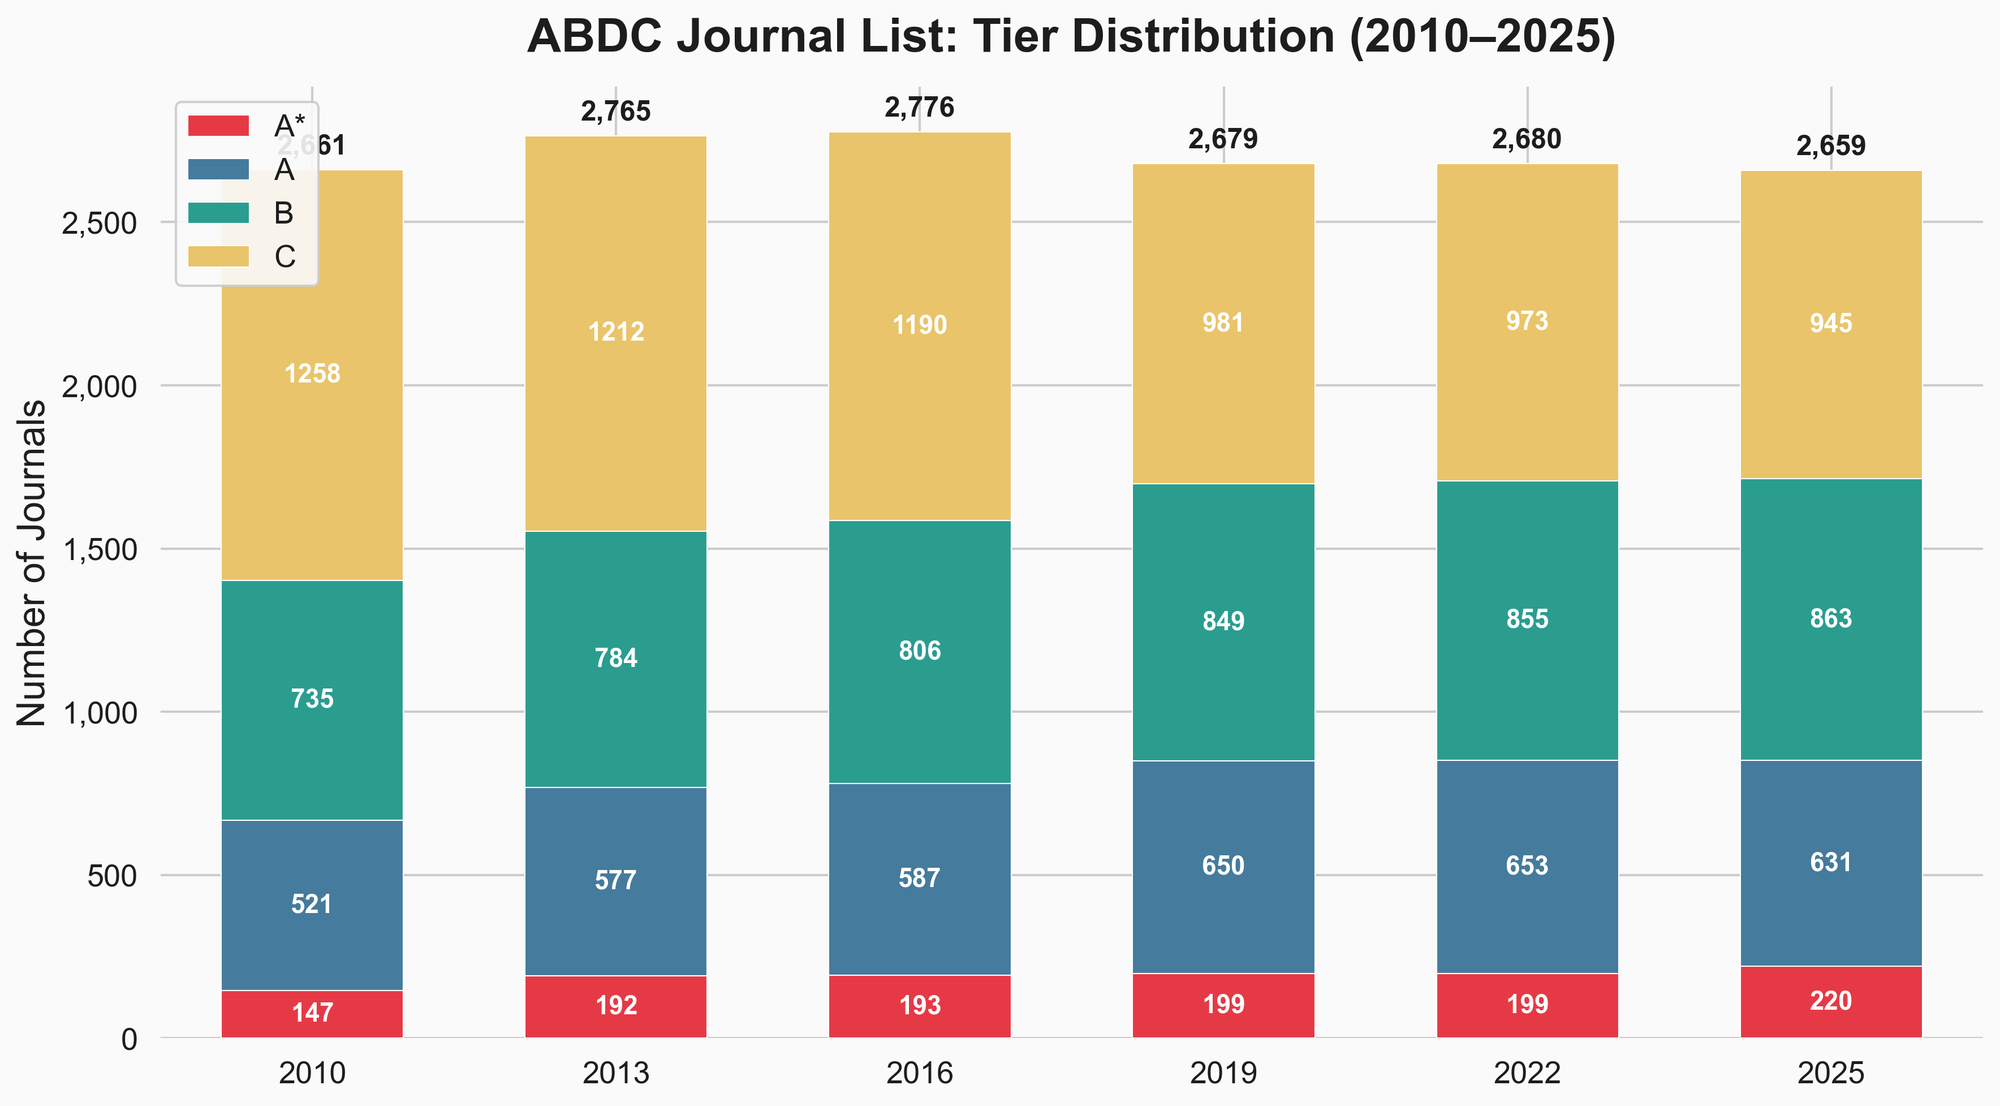
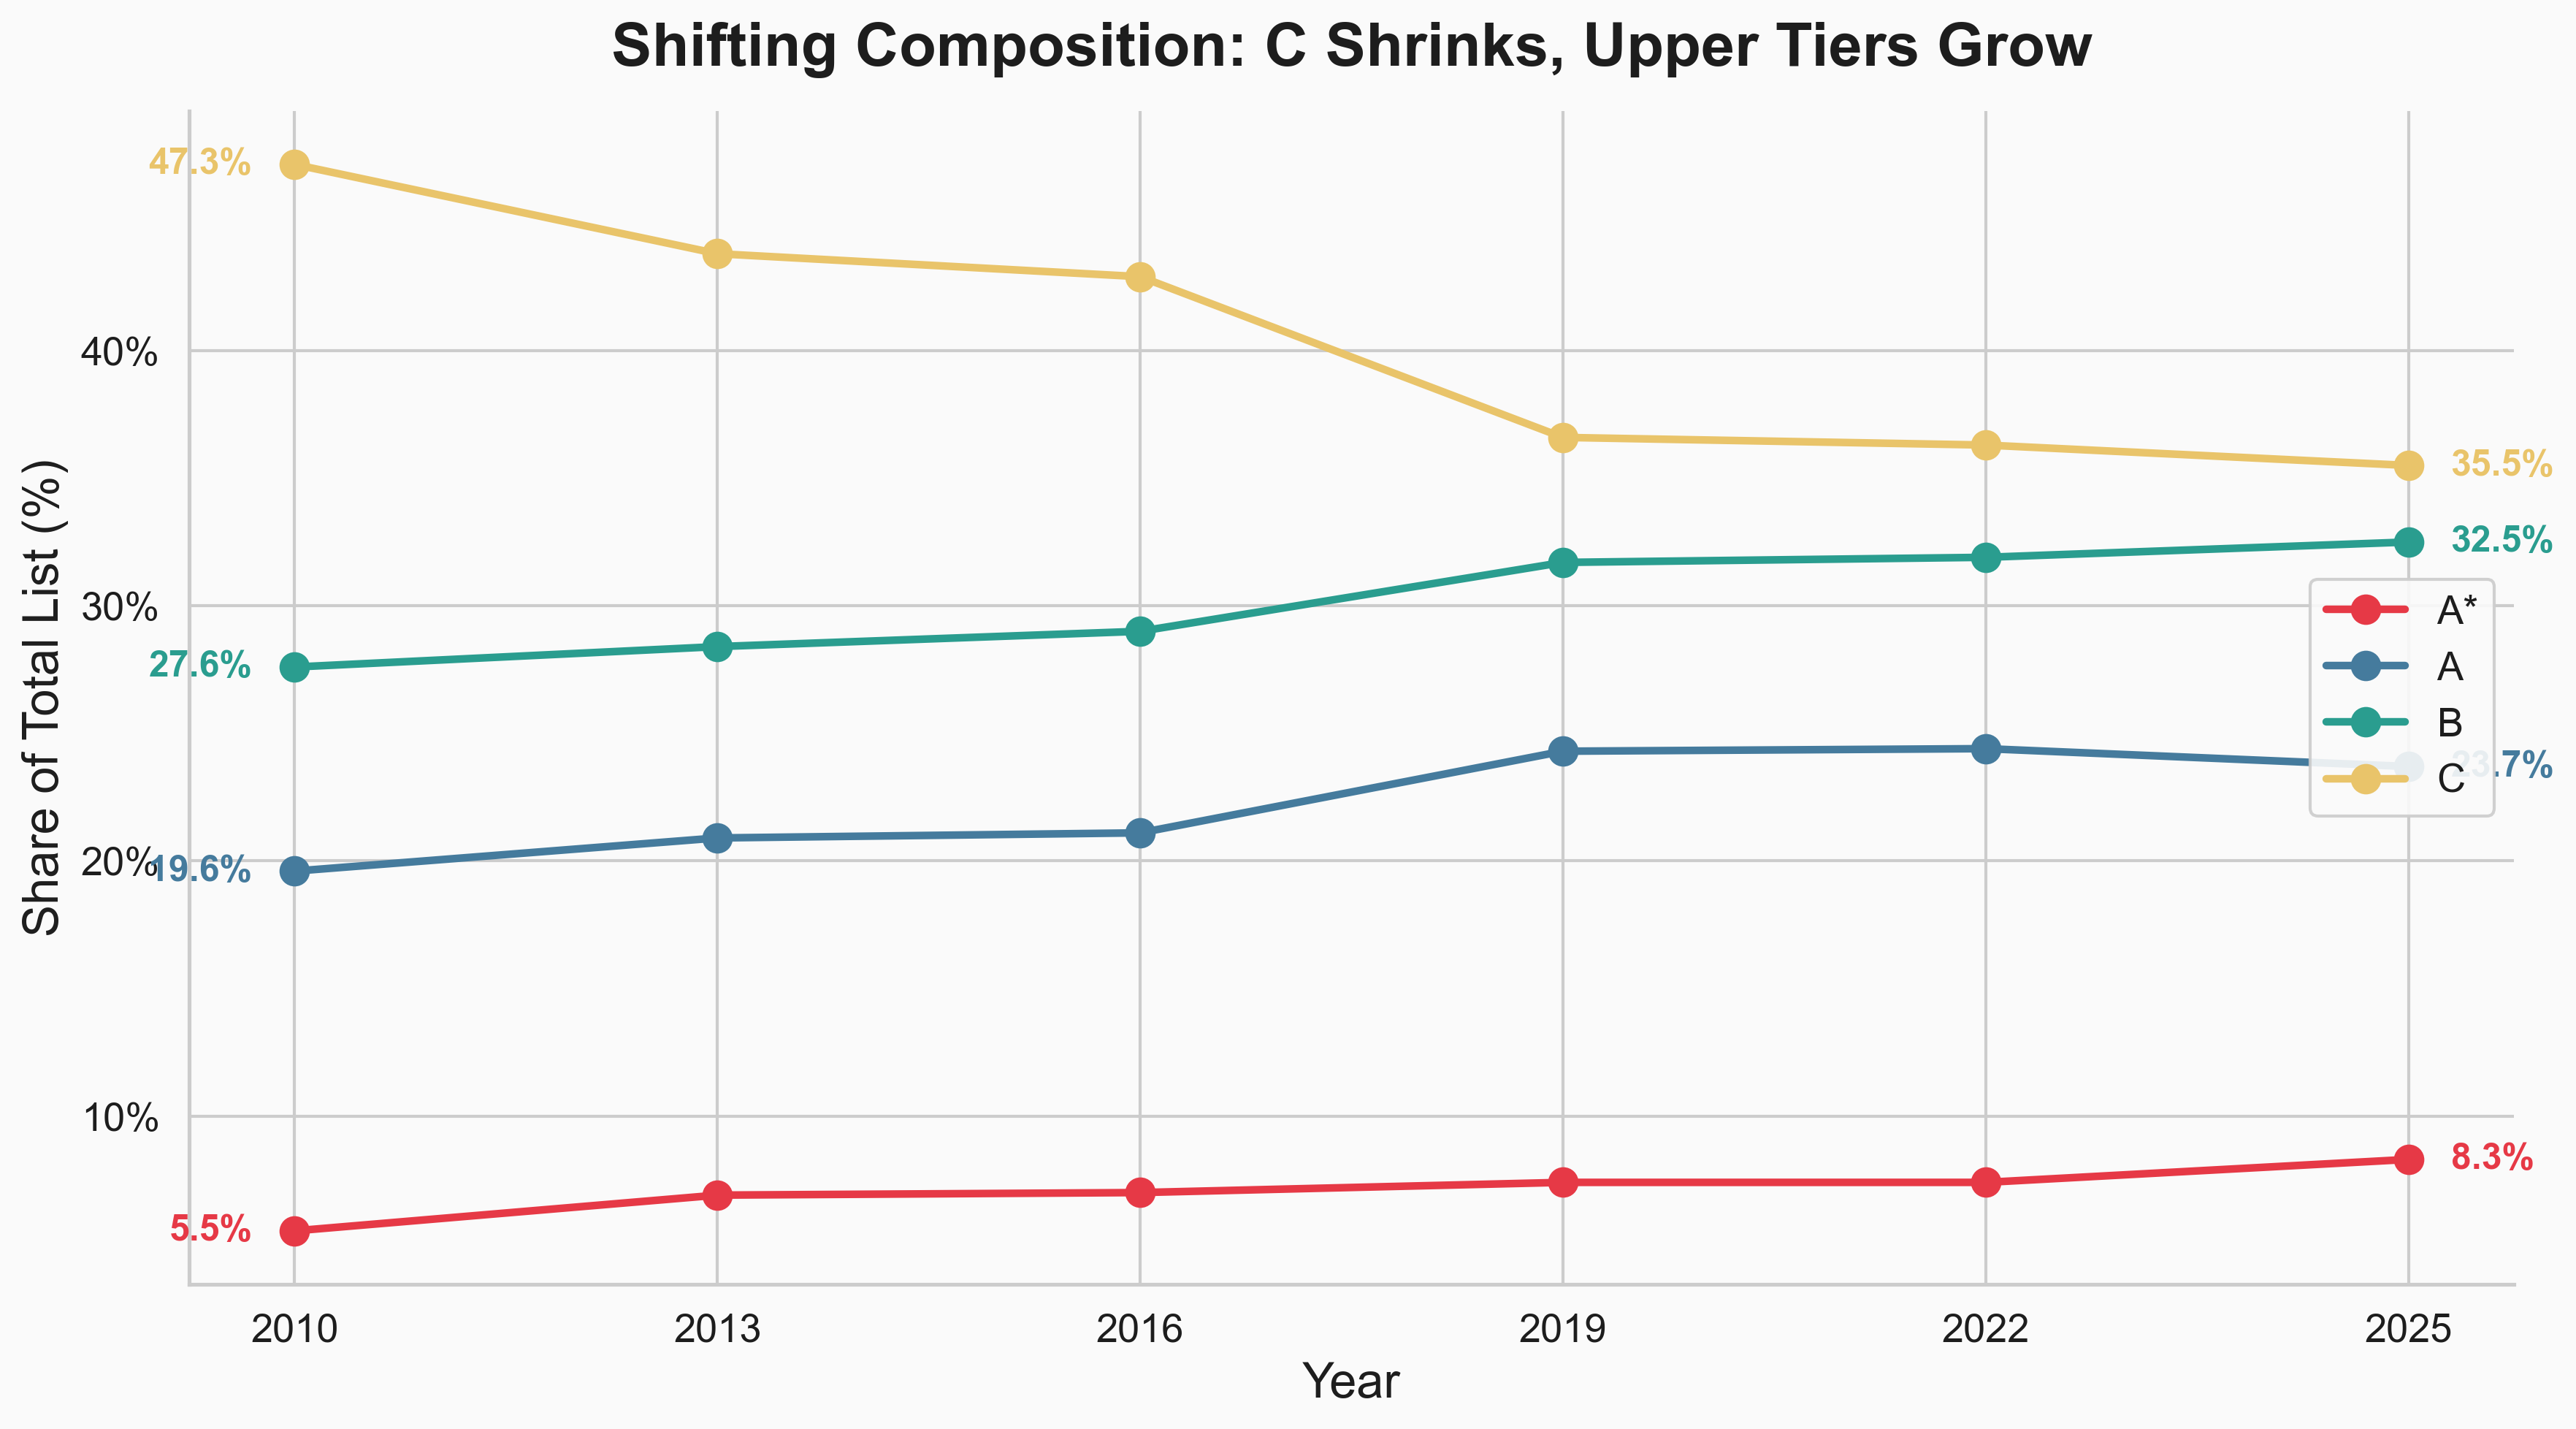
The aggregate trend: upper tiers grow, C shrinks
Here’s how the tier shares have moved:
| Tier | 2010 | 2025 | Change |
|---|---|---|---|
| A* | 5.5% | 8.3% | +2.8pp |
| A | 19.6% | 23.7% | +4.1pp |
| B | 27.6% | 32.5% | +4.9pp |
| C | 47.3% | 35.5% | –11.8pp |
In 2010, nearly half the list was C-rated. By 2025, it’s about a third. The upper tiers (A* + A + B) now make up 64.5% of the list, up from 52.7%.
On the surface, this looks like progress. More journals qualifying at higher tiers. Fewer at the bottom. The average quality of a listed journal appears to be rising.
But is that actually what’s happening? Are journals genuinely improving and earning their way up? Or is the list being reshaped by other forces?
I tracked individual journals across all six lists using ISSN matching to find out. The answer depends on whether you’re looking at the top of the list or the bottom.
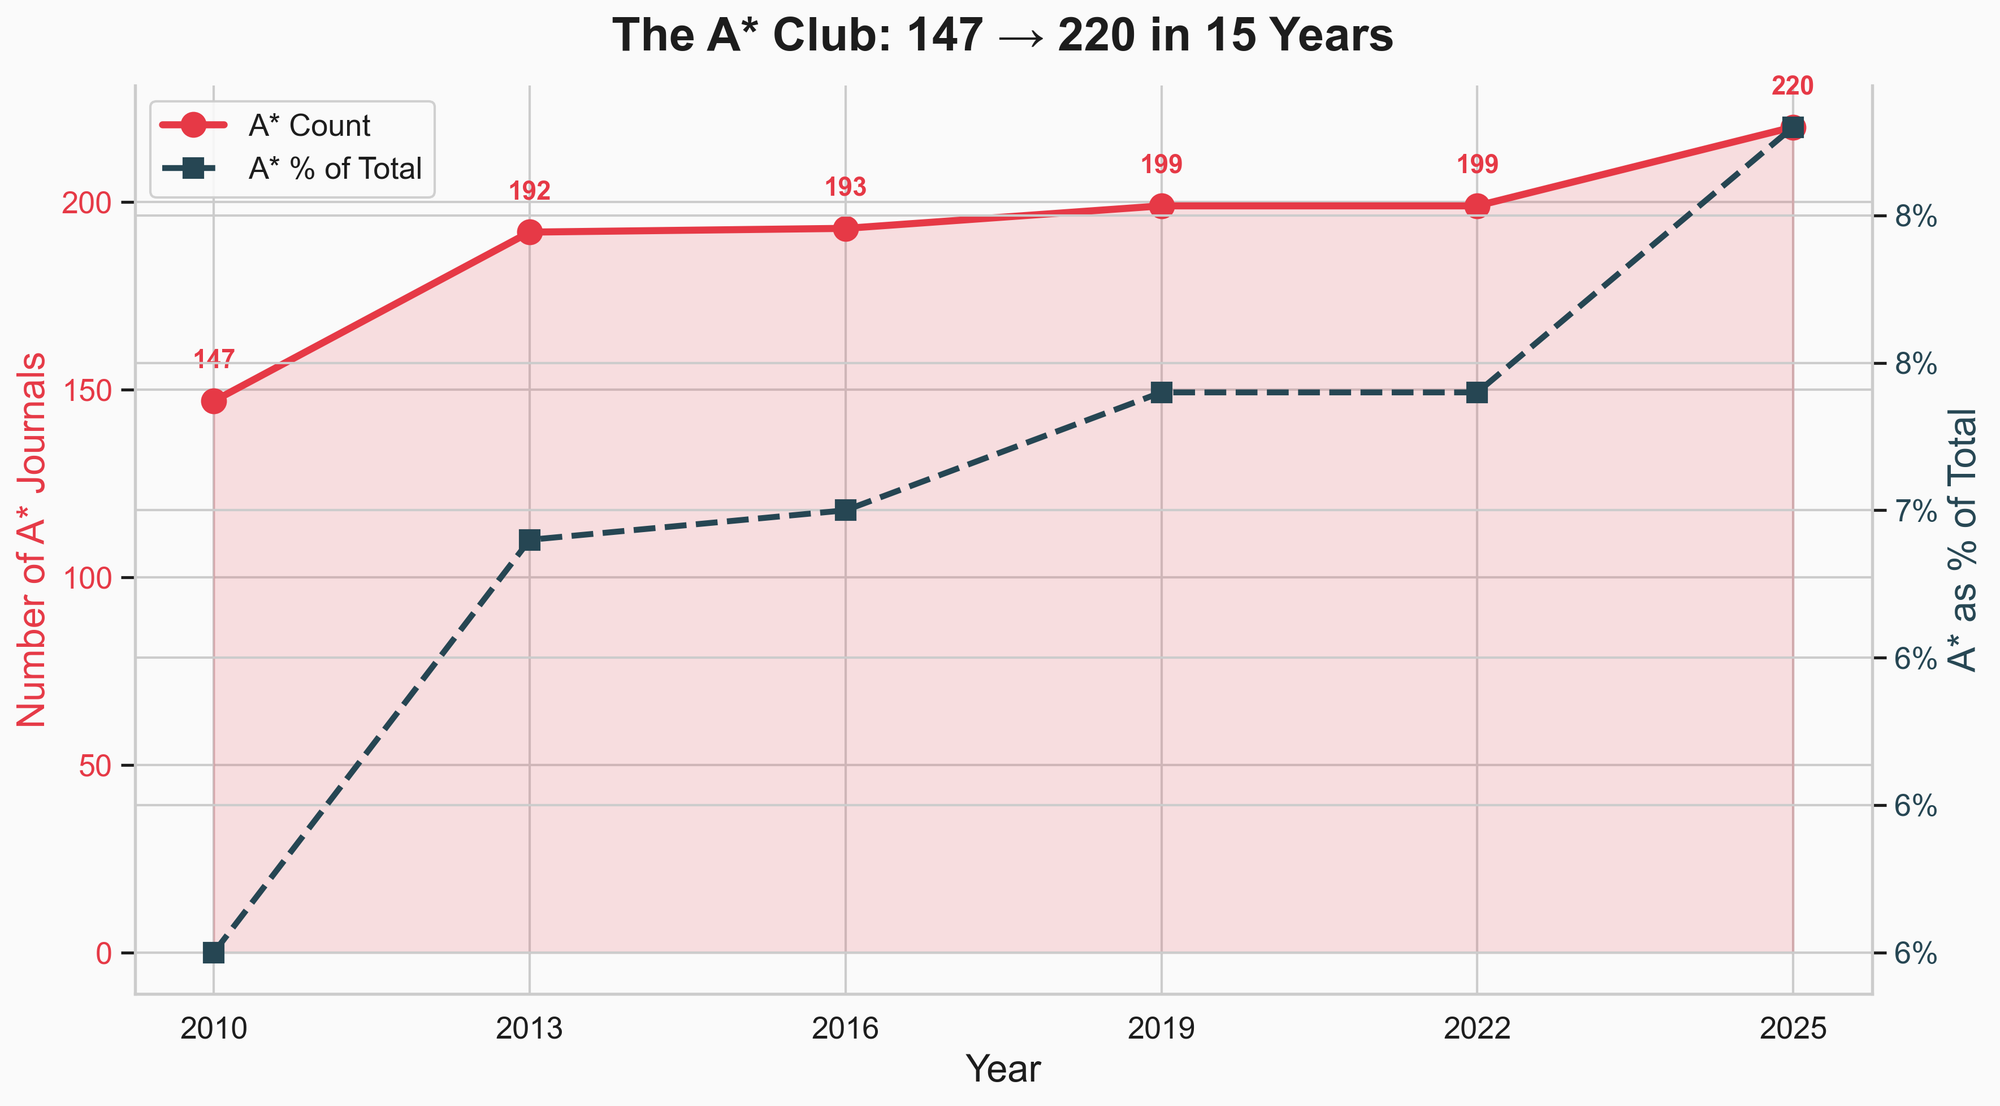
At the top: A* growth is largely earned
The A* category has grown from 147 journals to 220 — a 50% increase in 15 years. More elite journals means more doors at the top. That sounds like the bar is lowering.
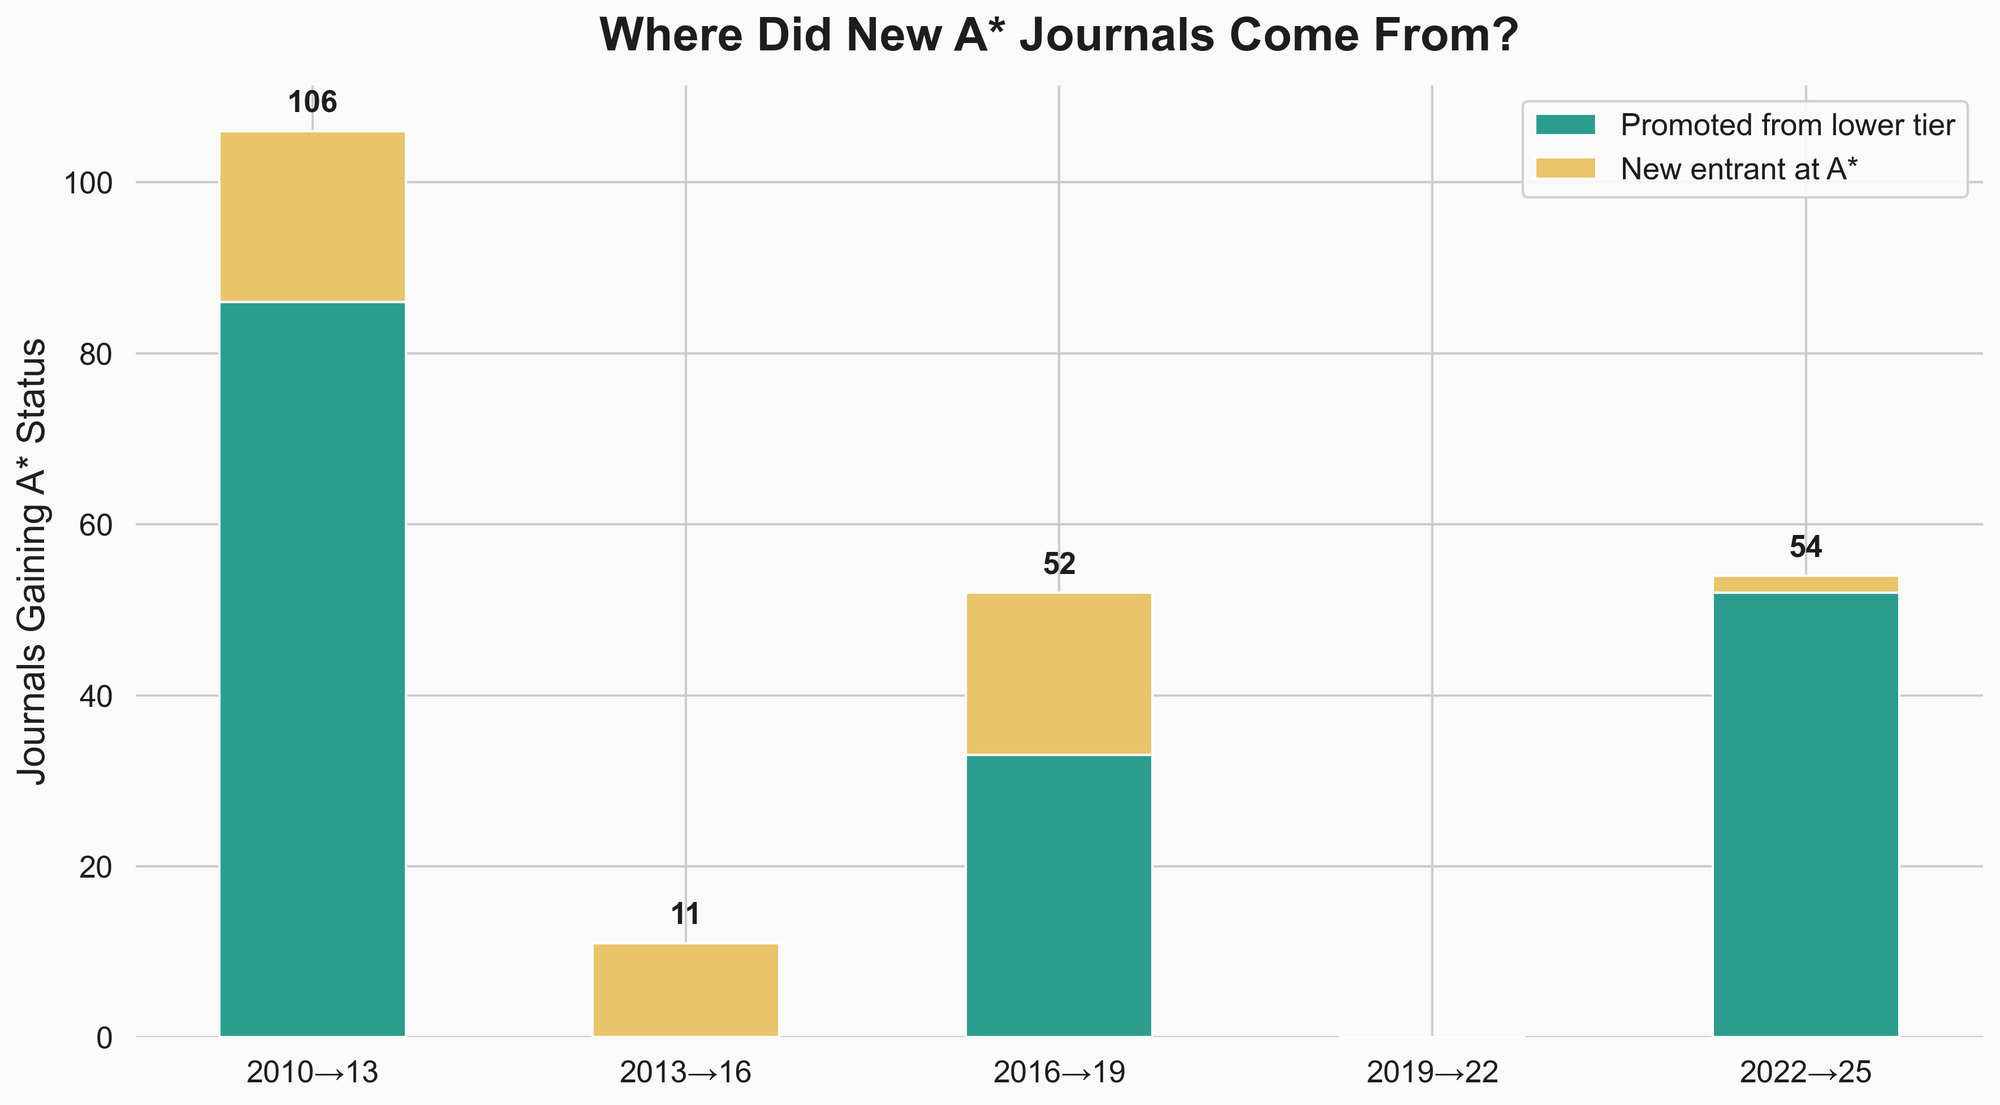
But when you track where those new A* journals actually came from, the picture changes.
Of all journals that gained A* status over 15 years:
- 76.7% were promoted from lower tiers (overwhelmingly from A)
- 23.3% were new entrants added directly at A*
The A* expansion isn’t inflation. It’s mostly journals that spent years at lower tiers proving themselves and earning the upgrade.
The breakdown by cycle is revealing. The 2010→2013 wave was massive — 86 promotions plus 20 new entrants. The 2022→2025 draft is almost entirely promotions (52) with only 2 new entrants at A*. The panel is clearly rewarding upward trajectories rather than importing prestige.
So if you’re targeting a journal that’s been steadily climbing through A toward A*, that trajectory is real signal. The A* club is expanding, but the membership is largely earned.
At the bottom: a very different story
Now here’s where the aggregate narrative breaks down.
The C-tier shrank by over 300 journals in 15 years. That sounds like the bottom of the list is improving — weak journals getting better, moving up.
It isn’t.
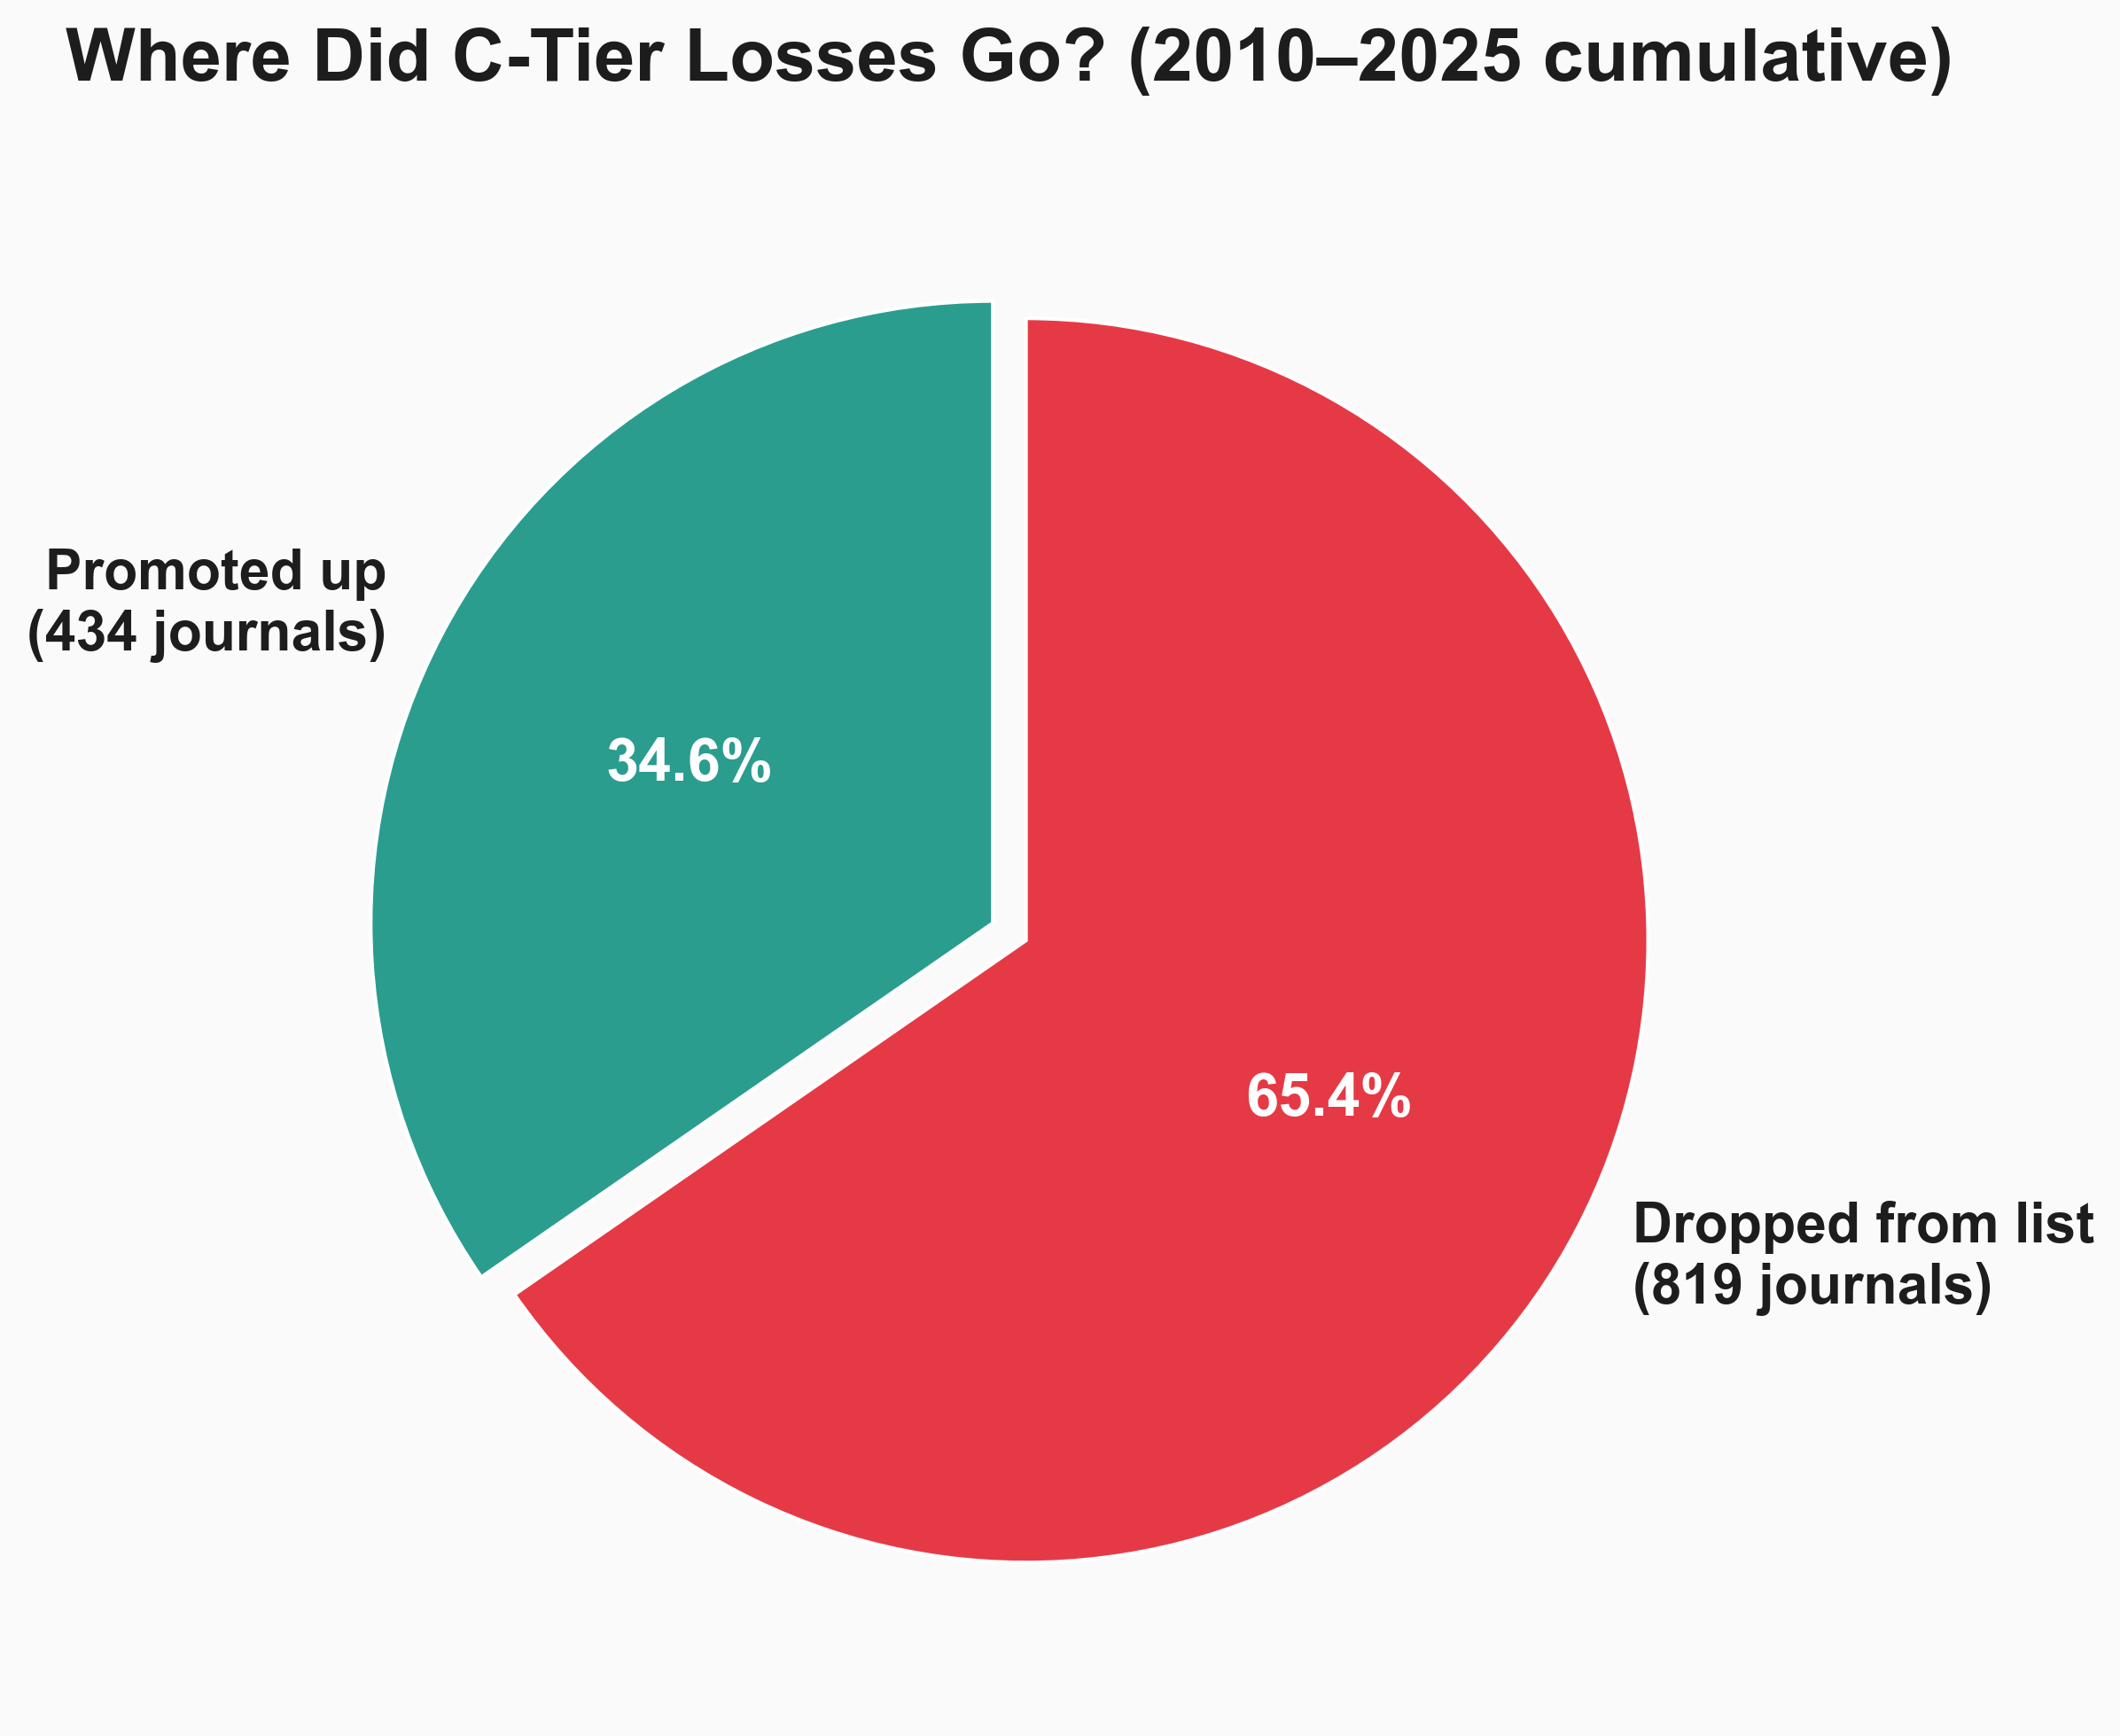
I tracked what happened to every C-rated journal across each review cycle. Of all C-tier losses over 15 years:
- 34.6% were promoted up (to B, A, or A*)
- 65.4% were dropped from the list entirely
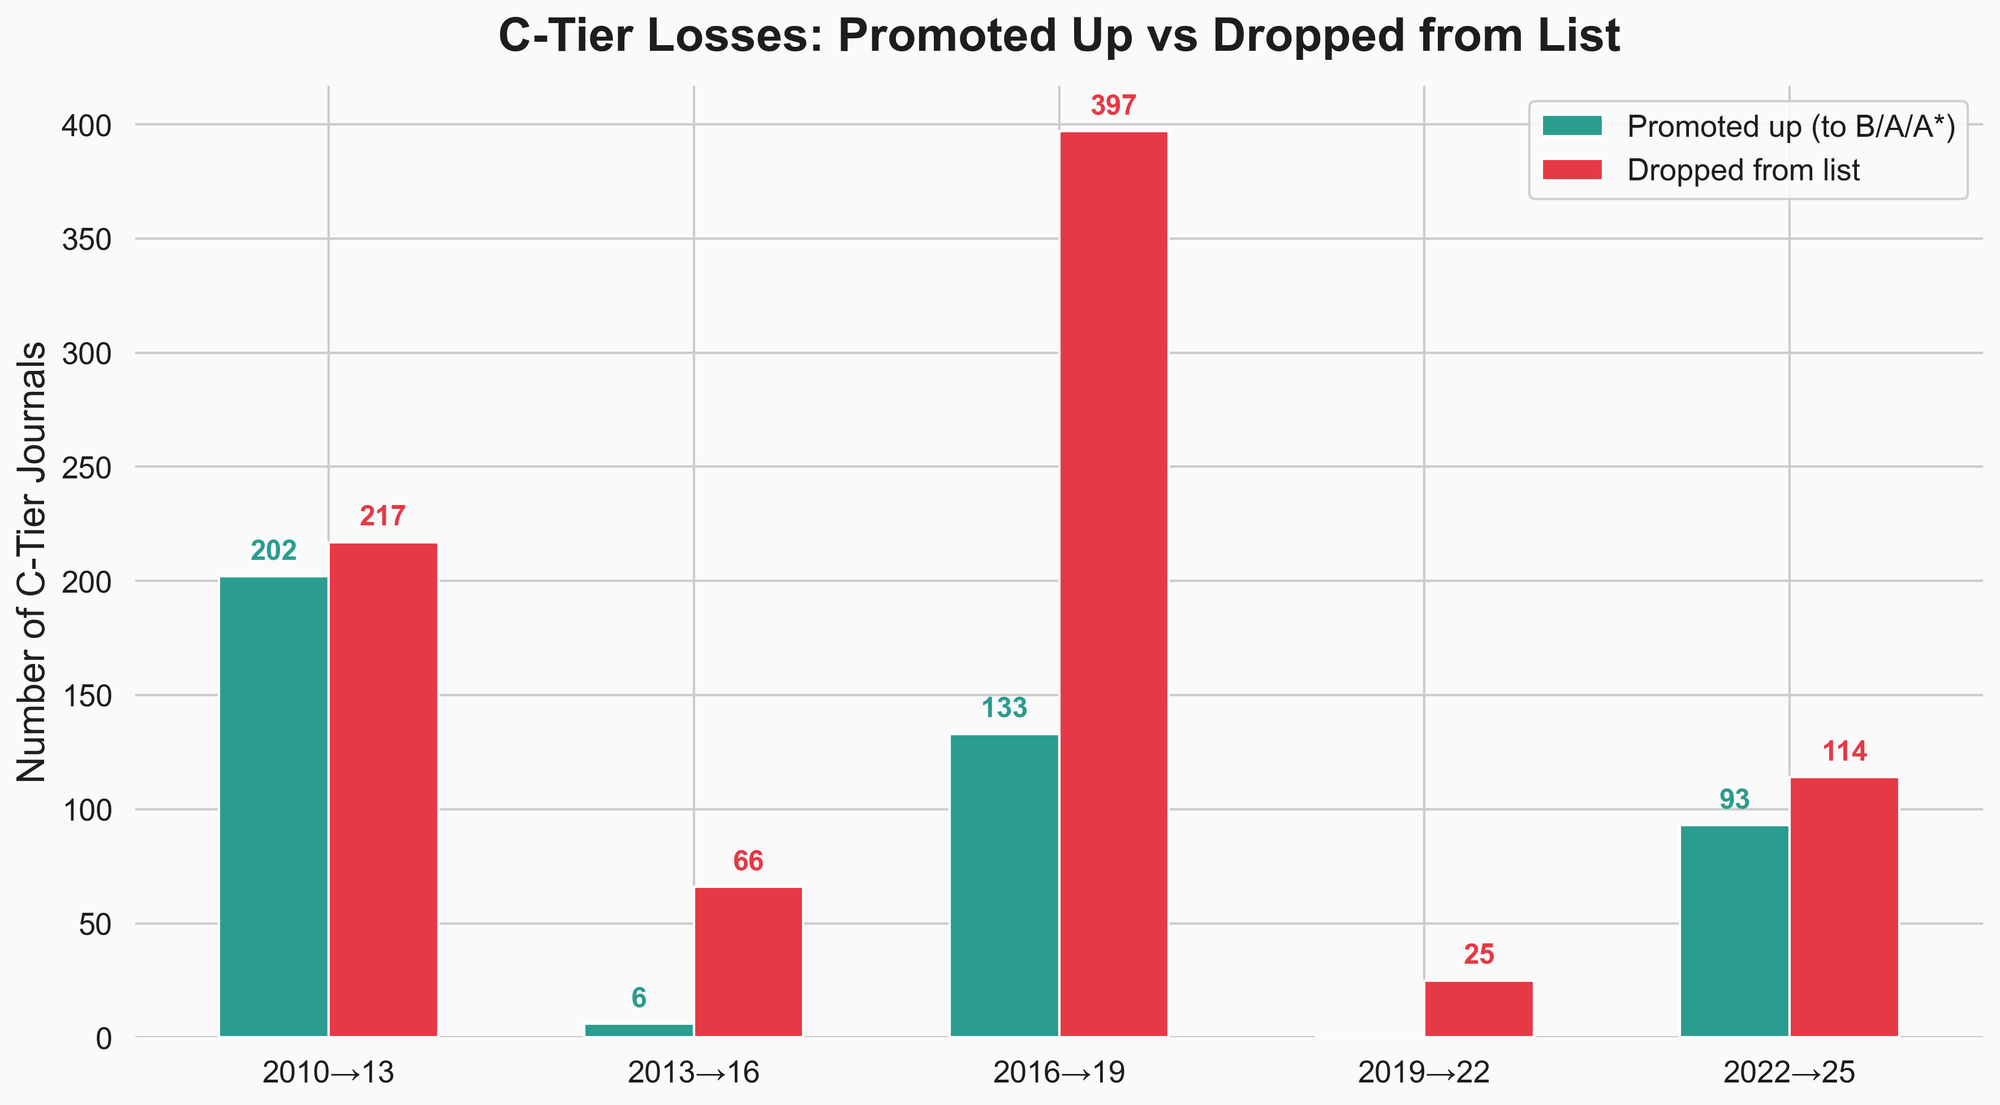
The C-tier didn’t improve. It was culled.
And here’s the kicker: 832 new journals entered at C-tier across the same period — nearly replacing the 819 that were removed. The C-tier is a revolving door. Journals come in, some get dropped, new ones take their place, and the aggregate composition shifts upward because the removals aren’t being counted anymore.
This is a textbook case of Simpson’s Paradox. The aggregate looks like upward mobility across the list. But at the individual journal level, the dominant force at the bottom isn’t promotion — it’s removal and replacement.
The list looks more “elite” not mainly because journals climbed the ladder, but because the bottom rungs keep getting pulled out and rebuilt.
Not all review cycles are created equal
The variation between cycles is itself a finding.
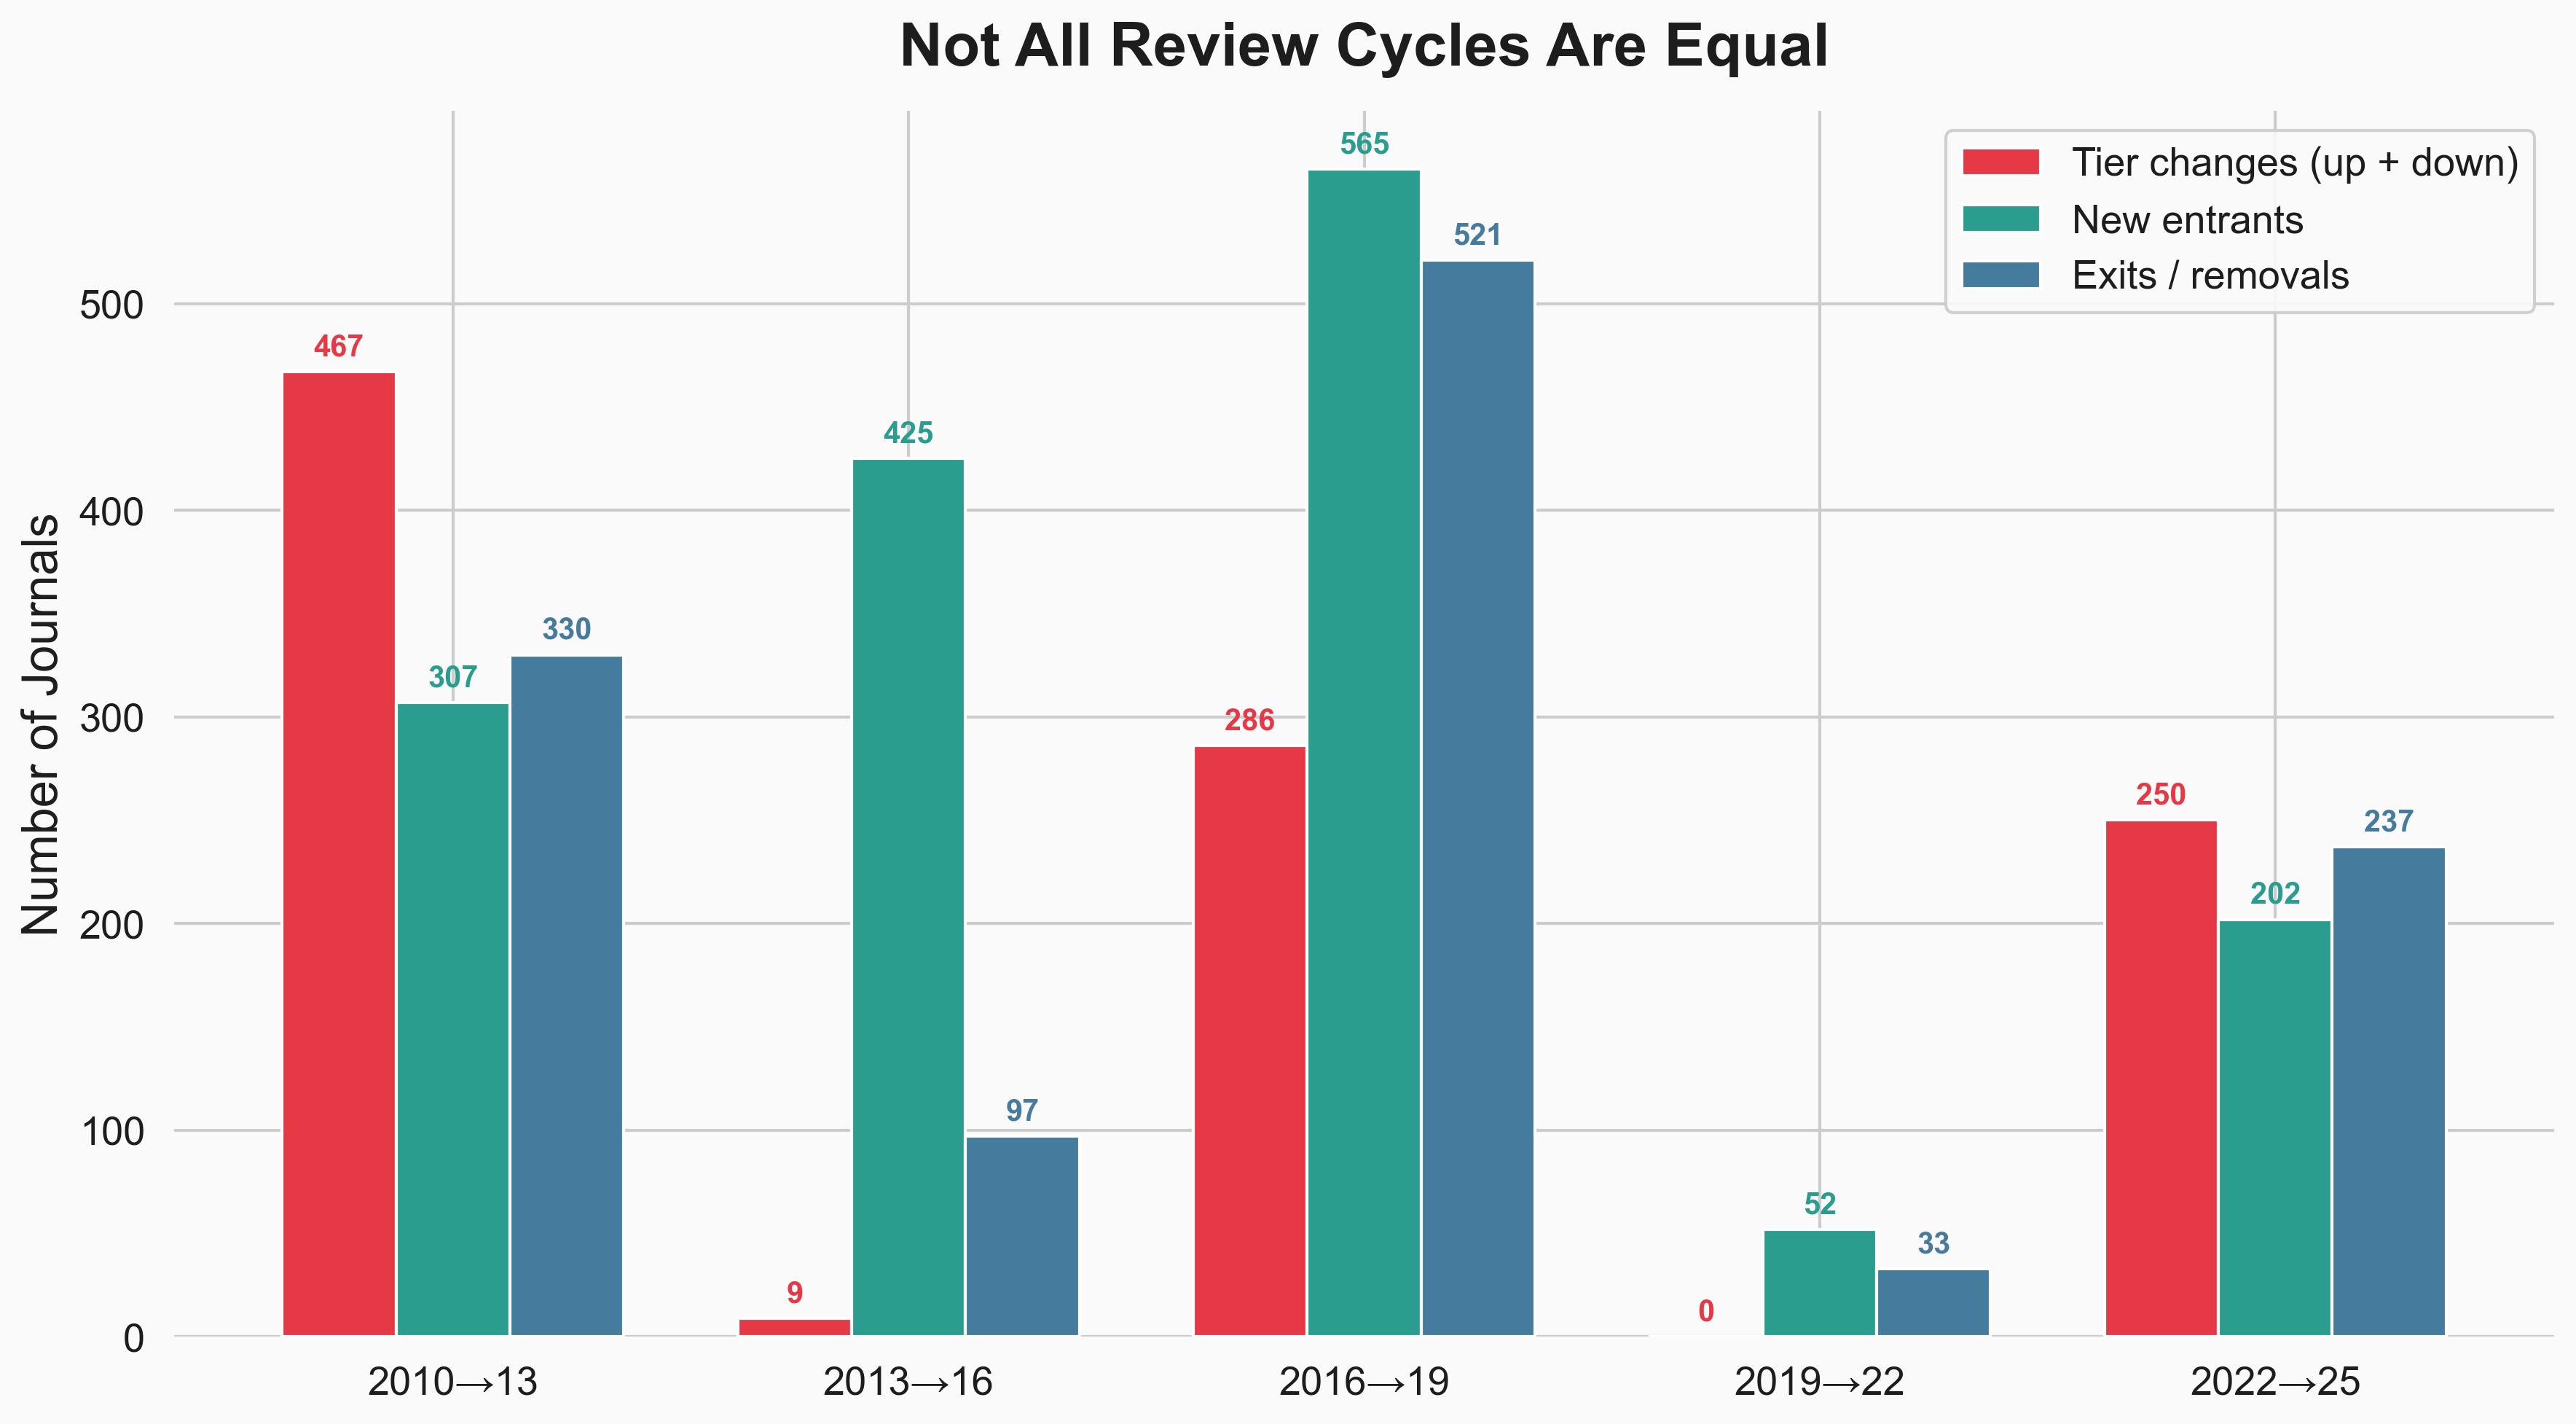
Some cycles reshape the list. Others barely touch it:
2010→2013 was a reclassification wave. 467 journals changed tiers. 307 new entrants. 330 exits. The panel was actively reshaping the list’s composition.
2013→2016 was the opposite for existing journals — only 9 tier changes among continuing journals. But 425 new journals flooded in. The list grew without internal movement.
2016→2019 was the highest-churn cycle overall. 286 tier changes, 565 new entrants, 521 exits. Massive turnover in both directions.
2019→2022 was frozen. Zero promotions. Zero demotions. Just 52 new entrants and 33 exits. The list was effectively left untouched.
2022→2025 marks a return to active management. 250 tier changes, 202 new entrants, 237 exits — including the 141 proposed removals.
The implication: whether your journal moves up, stays put, or gets dropped may depend as much on which review cycle it falls into as on the journal’s actual trajectory. Some panels reclassify aggressively. Others maintain the status quo. The system isn’t as consistent as it appears from the outside.
The 2025 draft: what’s changing now
The 2025 draft contains 2,800 rows, but 141 of those are journals recommended for removal. The actual proposed list is 2,659 journals.
Here’s the breakdown of what changed:
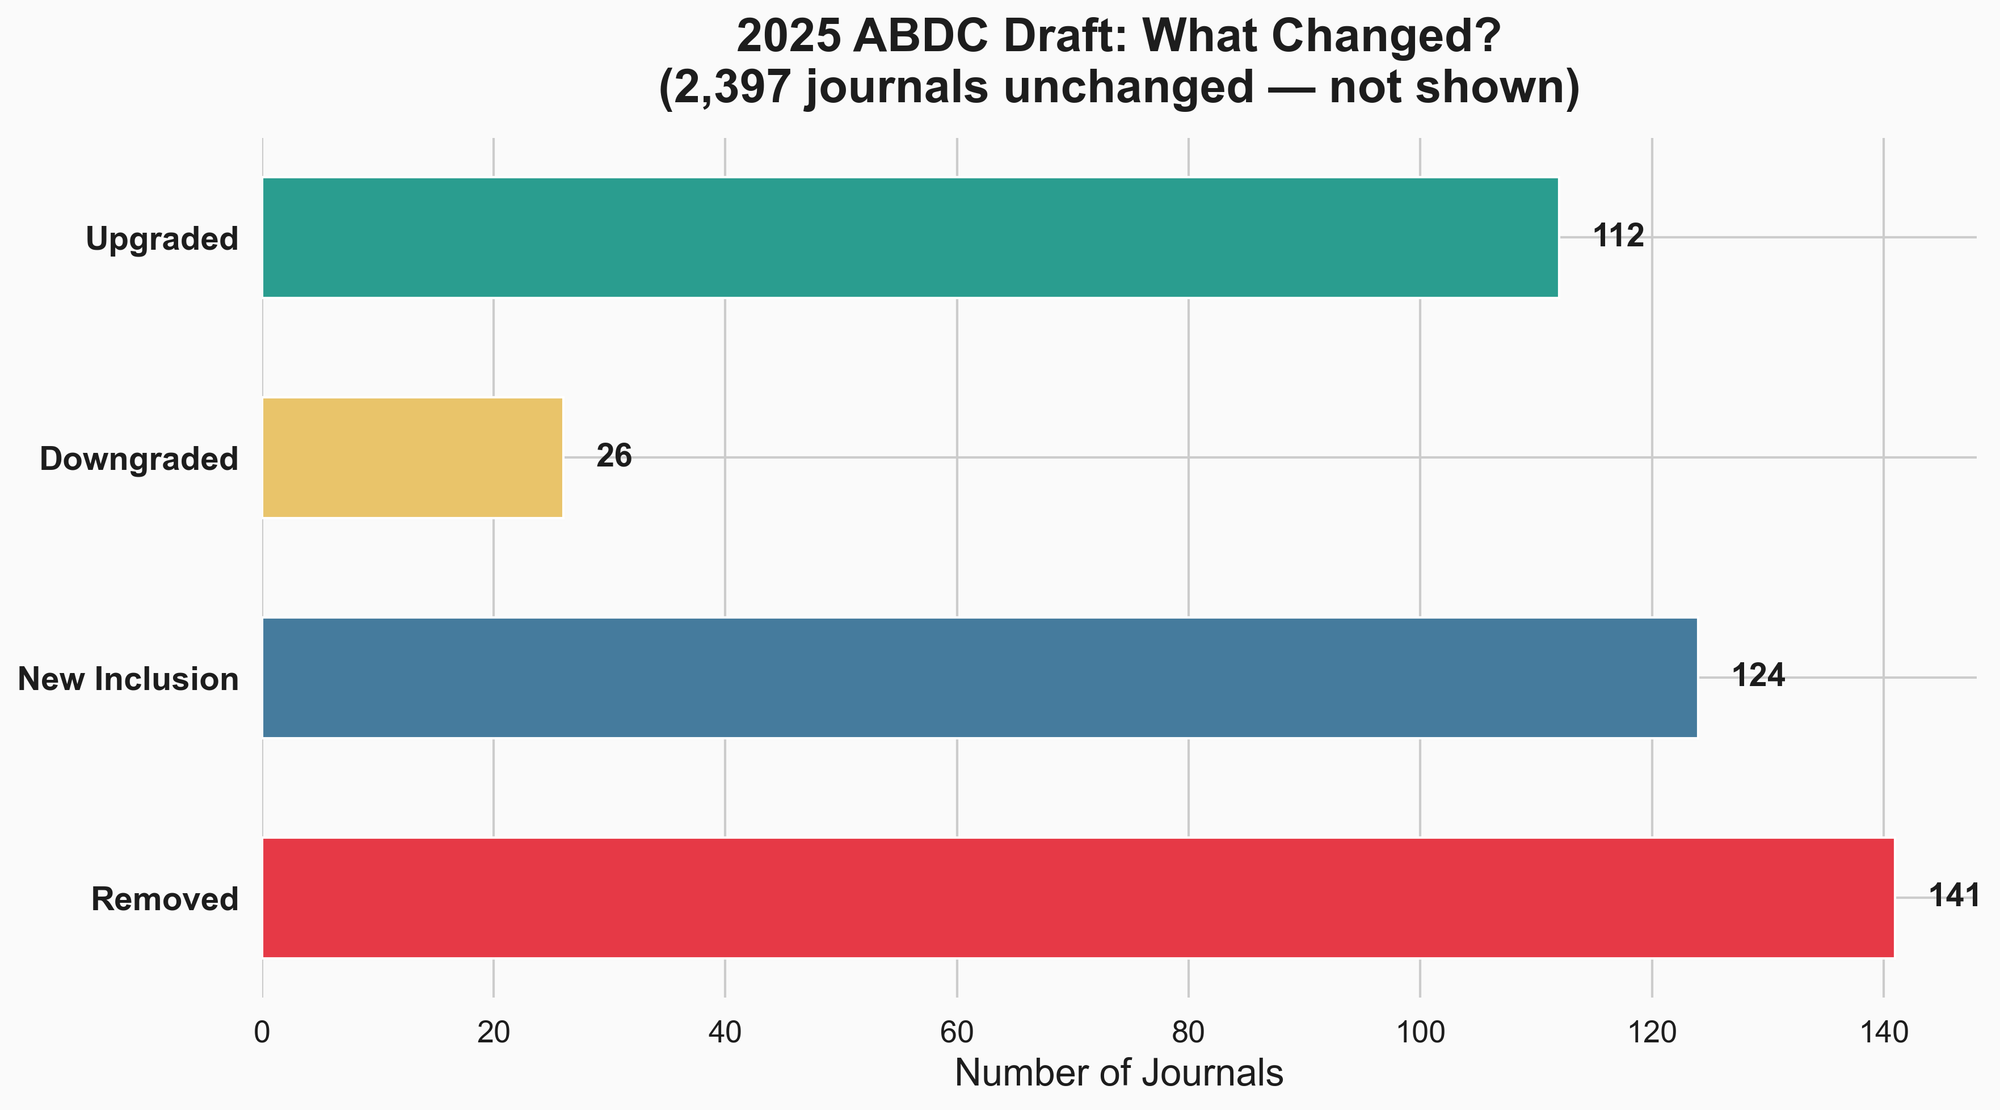
- 112 journals upgraded — the largest reclassification wave since 2016→2019
- 26 journals downgraded
- 124 new inclusions
- 141 journals removed
- ~2,397 unchanged
Upgrades outnumber downgrades more than 4 to 1. The panel is clearly more comfortable promoting than demoting.
The 141 removals are worth examining. They aren’t all from the bottom:
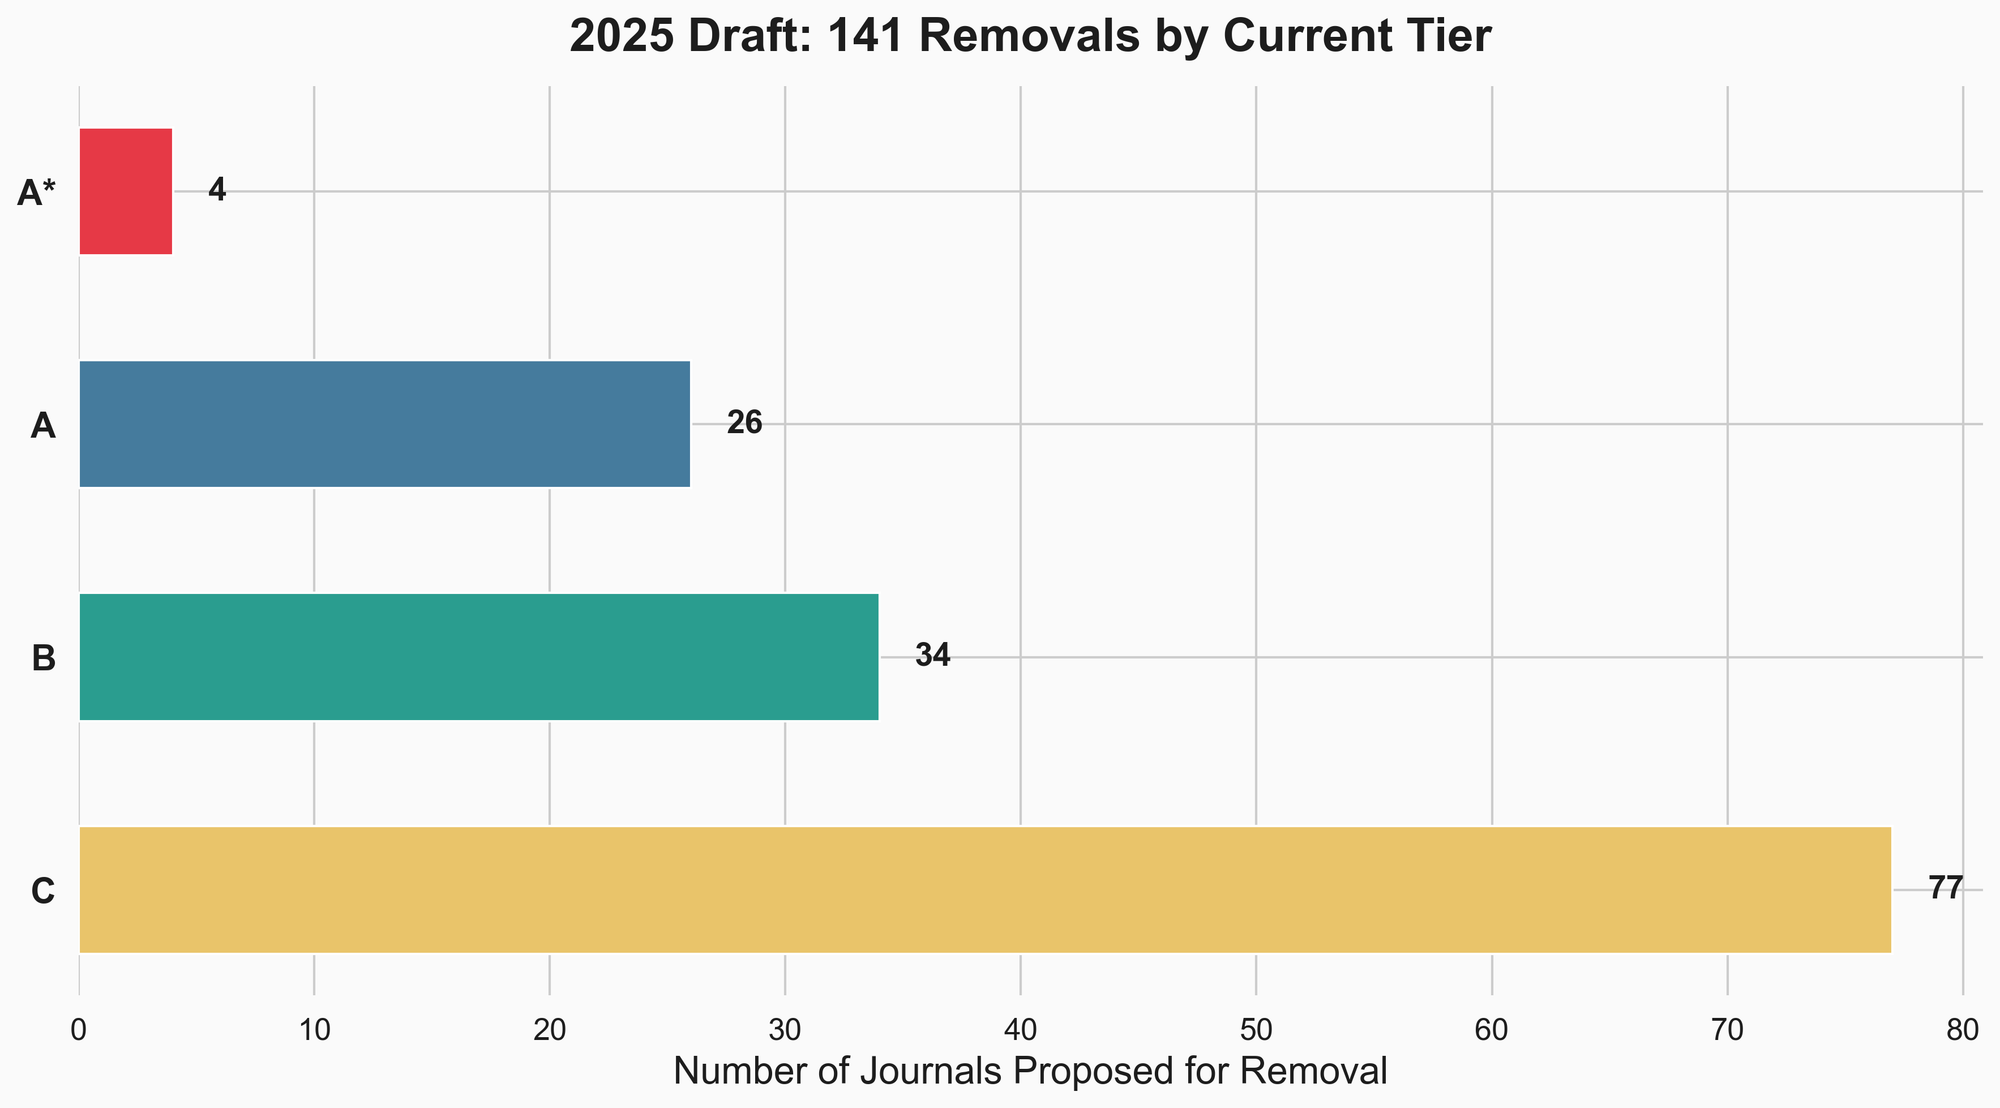
- 77 were C-tier (55%)
- 34 were B-tier (24%)
- 26 were A-tier (18%)
- 4 were A* (3%)
No tier is immune. Even 4 journals with the highest possible rating are proposed for removal.
What this means if you’re a researcher
The top-level numbers look clean: more A* journals, fewer C journals, a list that appears to be raising its standards. But the journal-level data tells a more complicated story.
1. A* growth is real signal. 77% of new A* journals were promoted from lower tiers. If your target journal has been climbing, that trajectory is meaningful. The A* club is expanding, but not through inflation.
2. C-tier stability is an illusion. 65% of C-tier losses were journals being dropped, not promoted. If you’re publishing in C-tier journals, check whether they’ve been on the list for multiple cycles or just arrived. A journal that’s been C for three cycles is a different proposition than one that just entered.
3. Review cycles are inconsistent. The 2019→2022 period had zero reclassifications. Whether your journal moves depends partly on which panel reviews it and when. Timing matters more than most researchers realise.
4. New entrants churn. Hundreds of journals enter and leave the list each cycle, mostly at B and C tiers. The list you’re looking at today may not be the list you’re evaluated against at your next review.
5. Removals aren’t limited to the bottom. The 2025 draft proposes dropping 26 A-tier and 4 A* journals. No tier is permanent.
The practical takeaway: don’t just check the current tier. Check the trajectory. How long has the journal been on the list? Has it moved tiers? Is it in a field that’s gaining or losing representation?
But that last point — field representation — turns out to matter more than I expected.
The discipline-level view: not all fields are changing the same way
Everything above treats the ABDC list as a single entity. But the list covers a wide range of disciplines — from Management to Tourism to Law — and the shifts have played out very differently across fields.
I mapped each journal’s Field of Research (FoR) code across all six lists, accounting for the coding system change that happened between 2019 and 2022 (Australia switched from 2008 to 2020 ANZSRC codes).
Some disciplines contracted dramatically. Others expanded.
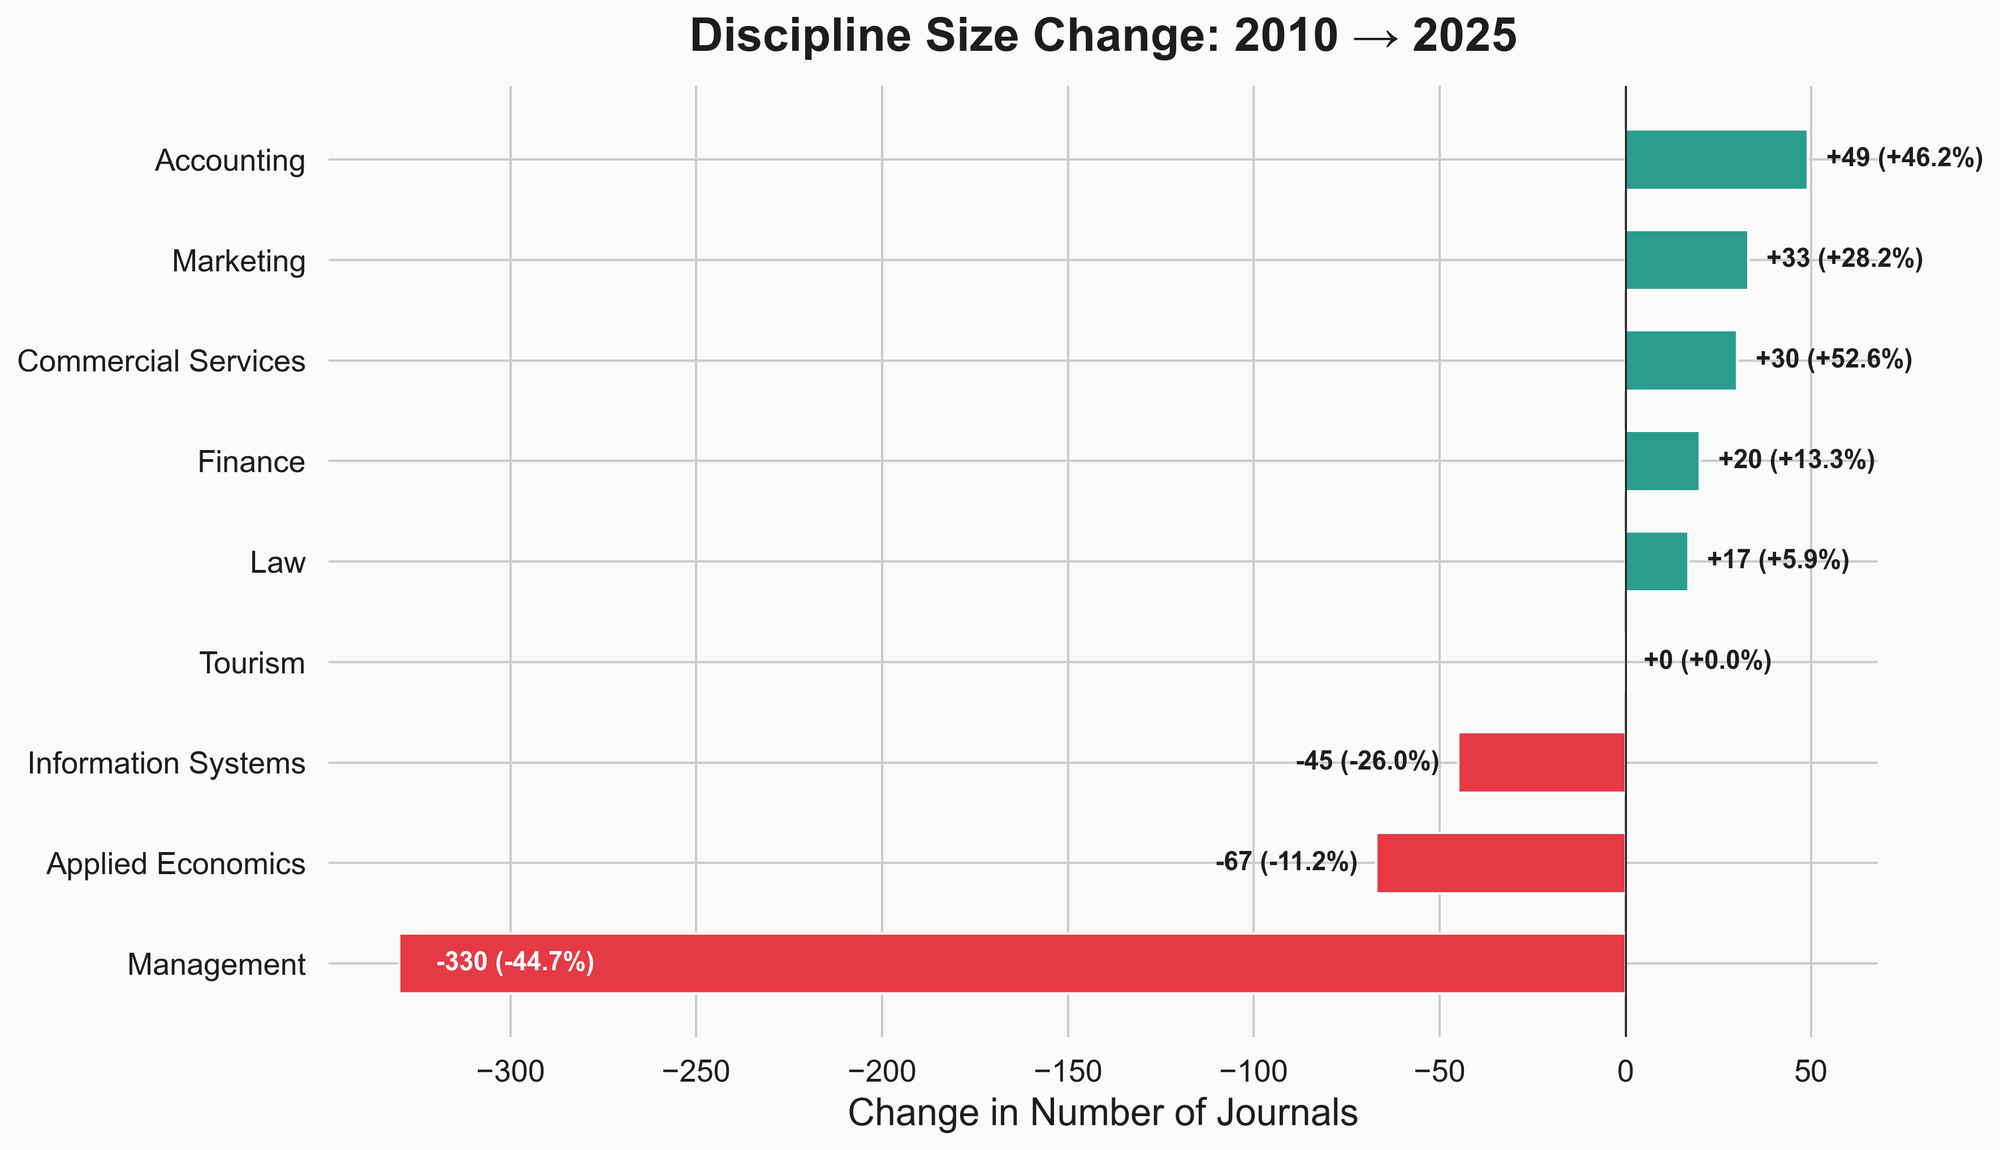
Management lost 45% of its journals — from 738 to 408 — the single largest contraction on the list. This is partly due to the FoR reclassification (some Management journals were reclassified into more specific categories like HR or Business Systems), but the scale is still striking.
Information Systems shrank 26%, from 173 to 128 journals.
Applied Economics lost 67 journals (–11%).
Meanwhile, Accounting grew 46% (106 → 155), Commercial Services grew 53% (57 → 87), and Marketing grew 28% (117 → 150). These are disciplines where the ABDC is recognising more venues, not fewer.
Tourism stayed exactly the same size — 79 journals in both 2010 and 2025. But what happened inside those 79 journals was dramatic.
A* expansion varies wildly by field
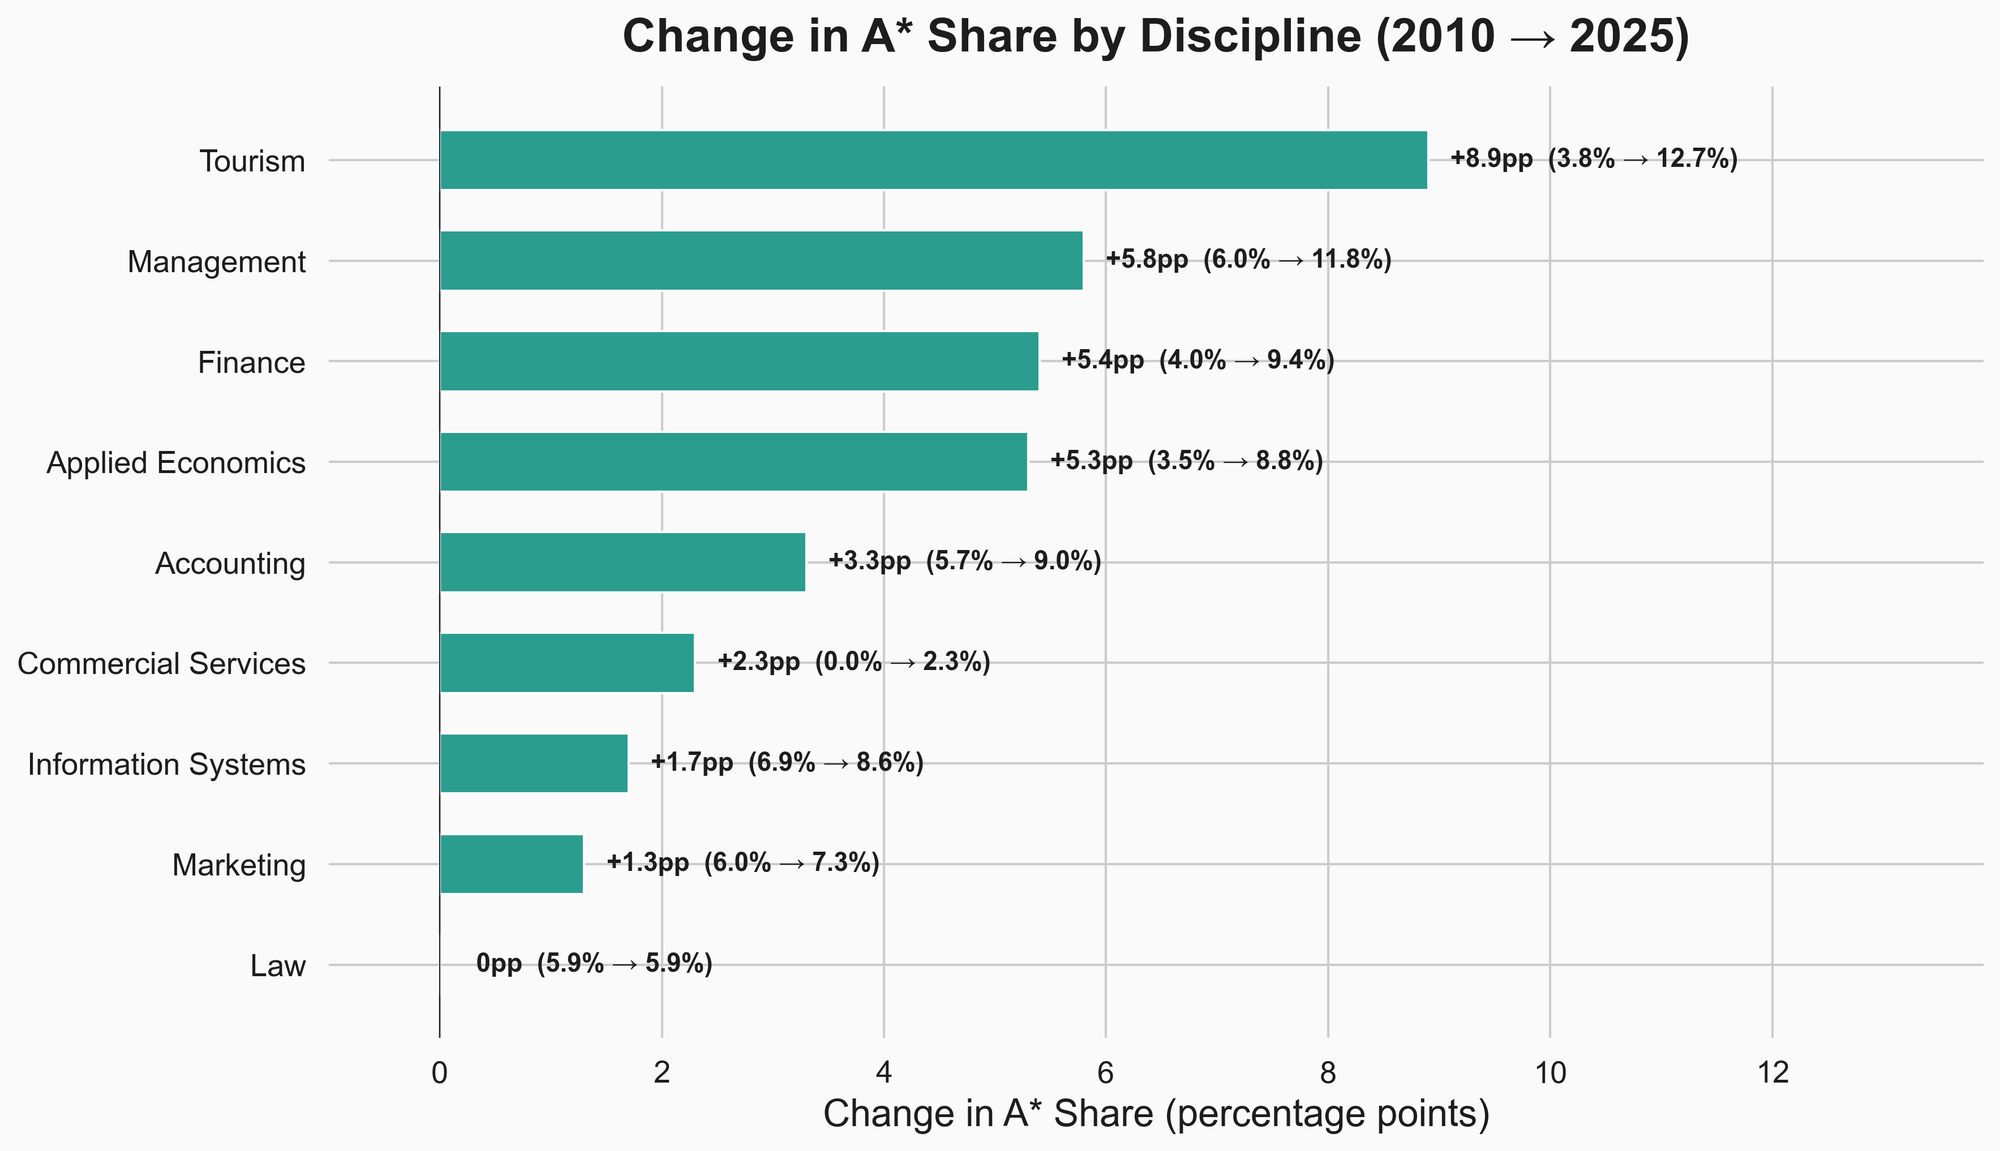
Tourism had the biggest A* jump: from 3.8% to 12.7% (+8.9 percentage points). On a base of 79 journals, that’s a shift from 3 A* journals to 10. A small discipline that got heavily reshaped at the top.
Management went from 6.0% to 11.8% A* (+5.8pp) — but remember, this happened while the discipline lost nearly half its journals. The A* share grew partly because the denominator shrank.
Finance and Applied Economics both saw about +5pp in A* share, with Finance growing in total size and Economics shrinking. Same aggregate trend, different underlying dynamics.
Law didn’t move at all. 5.9% A* in 2010, 5.9% in 2025. Essentially frozen for 15 years while every other discipline shifted.
C-tier shrinkage also varies
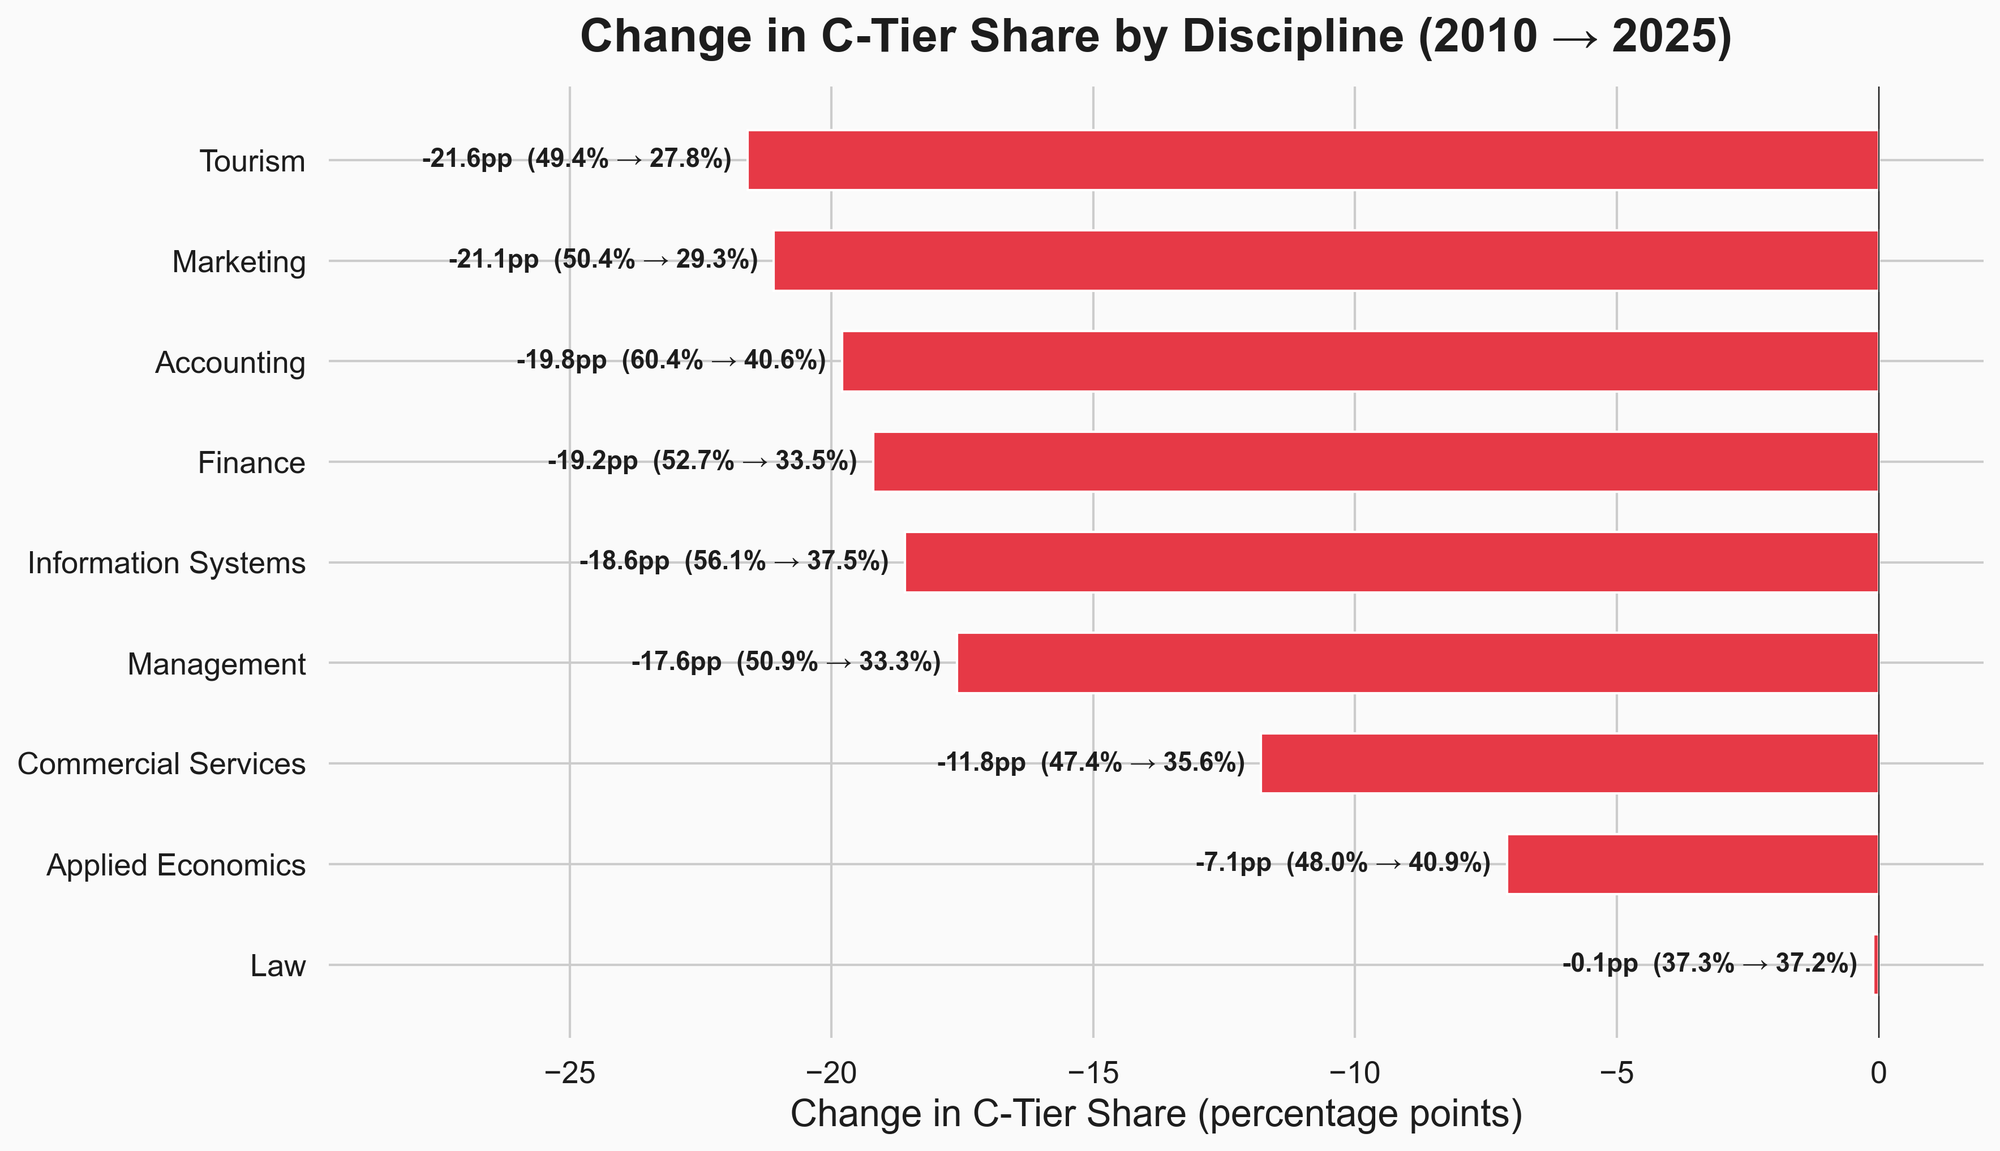
Marketing (–21.1pp) and Tourism (–21.6pp) saw the biggest C-tier drops. Both went from about half C-tier to under 30%.
Accounting (–19.8pp) and Finance (–19.2pp) followed close behind.
Law, again, barely moved: 37.3% to 37.2%. The legal journals on the ABDC list seem to exist in their own stable ecosystem.
Applied Economics had a relatively modest C-tier decline (–7.1pp), despite being the second-largest discipline on the list.
The full picture: six disciplines, six different stories
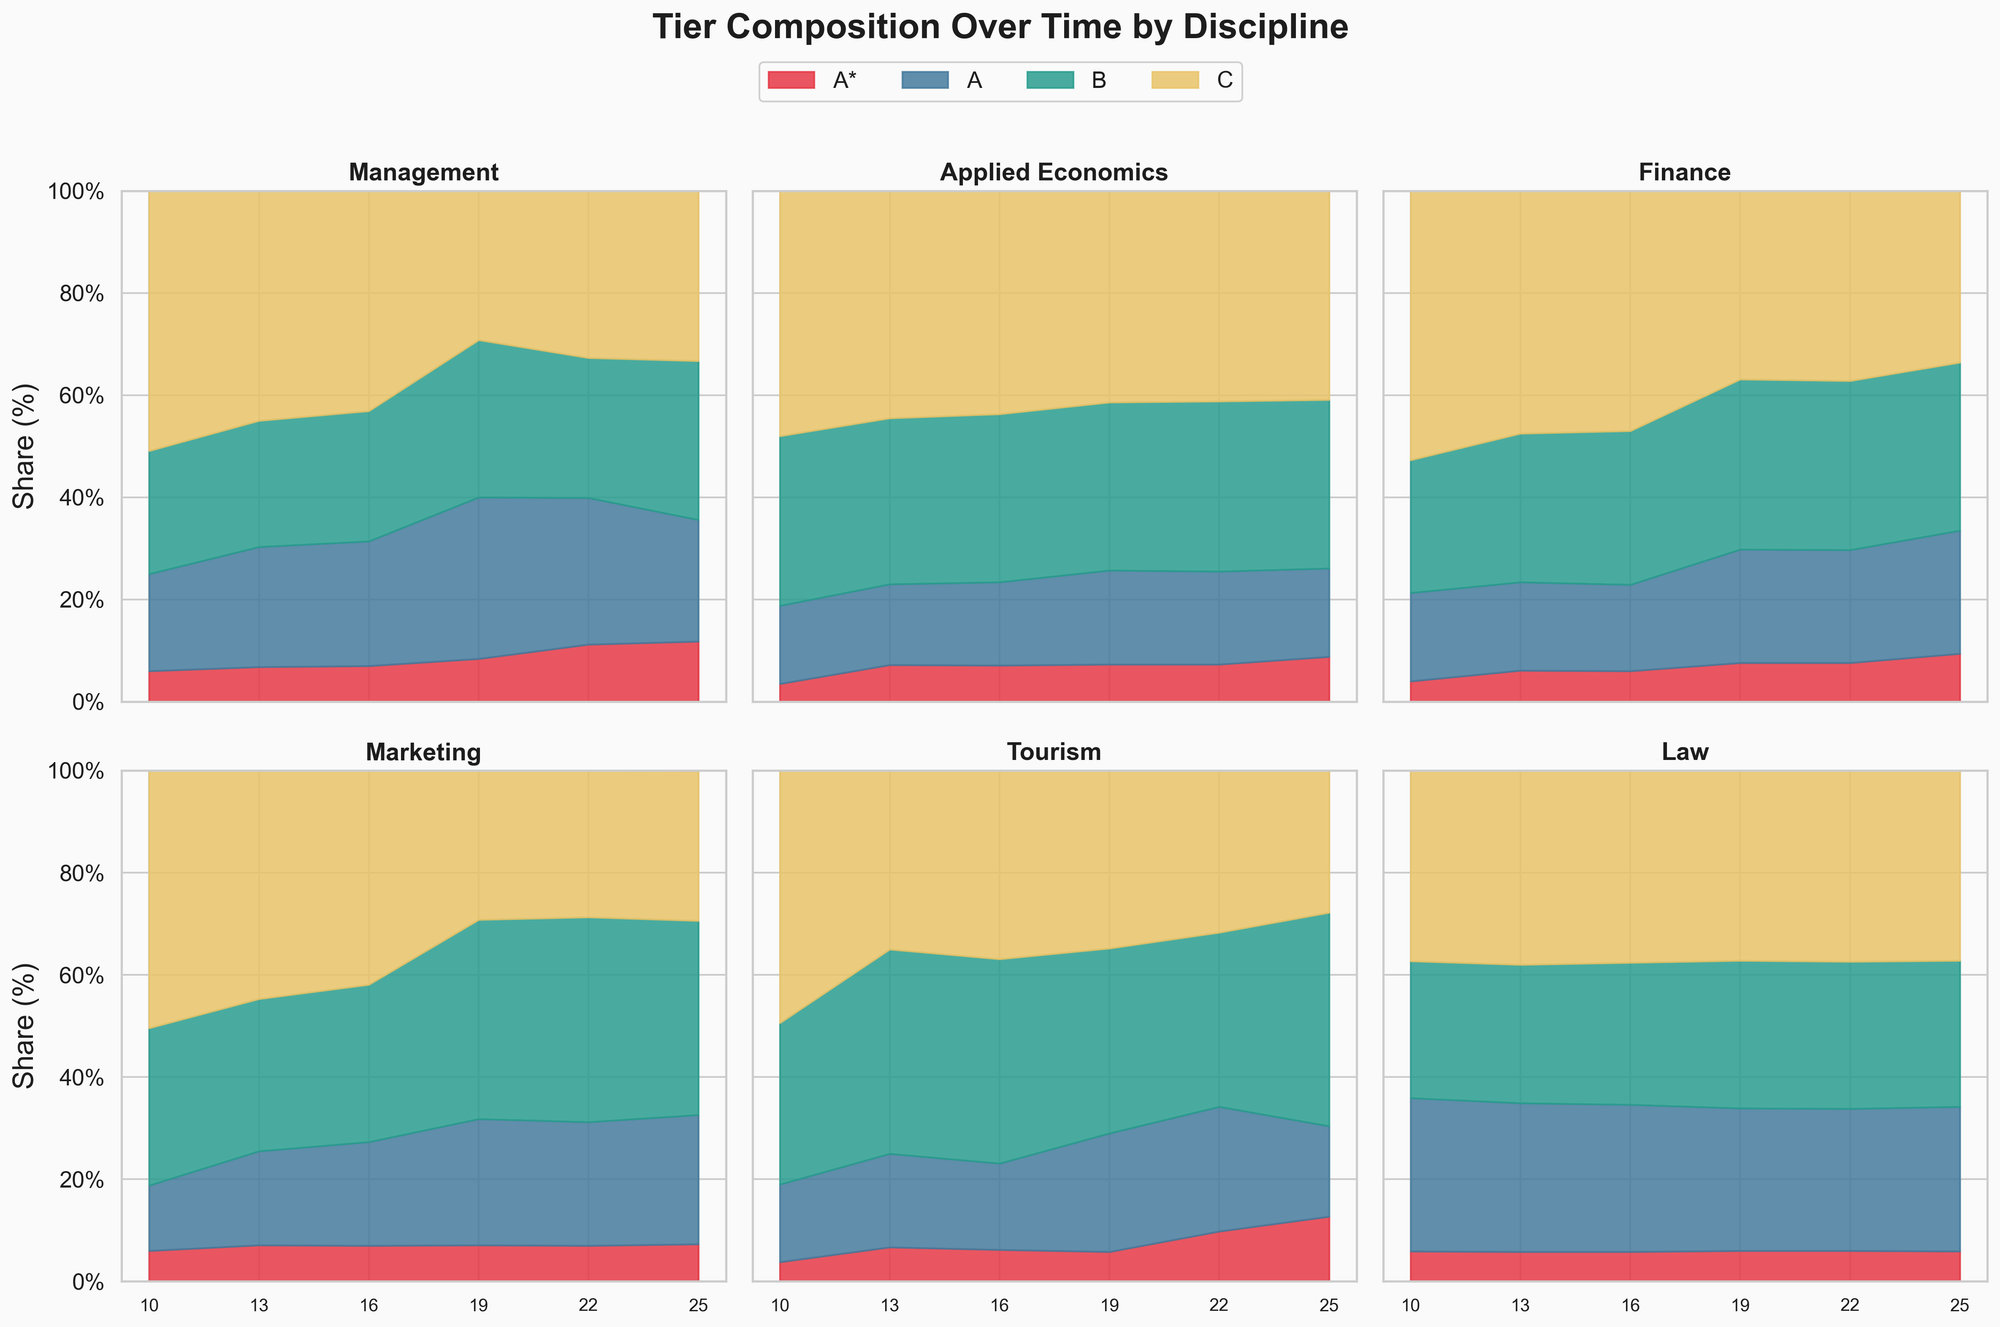
These small multiples tell the story at a glance:
- Management got dramatically more selective — fewer journals, higher concentration at the top
- Applied Economics shifted gradually and consistently
- Finance expanded at every tier except C
- Marketing saw steady upward drift across all cycles
- Tourism was relatively stable until 2025, when a sudden reclassification wave pushed its A* share to the highest of any discipline
- Law barely changed at all — a flat line in a sea of movement
What this means
The aggregate ABDC trends — more A*, less C — mask significant variation by discipline. A researcher in Marketing has experienced a very different list evolution than one in Law or Information Systems.
If you’re making publishing decisions based on ABDC rankings, the discipline context matters. An A-tier journal in a field where A* has expanded to 12% of journals is a different proposition than an A-tier journal in a field where A* has been frozen at 6% for 15 years.
Summary
The ABDC list looks stable from the outside — roughly 2,700 journals, reviewed every three years. But the internal dynamics are more complex than the headline numbers suggest.
At the aggregate level, the list is shifting upward: more A* journals, fewer C journals, a composition that looks increasingly selective.
At the journal level, the forces driving this are different at the top and bottom. A* growth is largely earned — journals promoted from lower tiers. C-tier shrinkage is largely removals — journals dropped from the list and replaced by new entrants.
At the cycle level, the list is inconsistently managed. Some review cycles reclassify hundreds of journals. Others change almost nothing.
At the discipline level, the trends diverge sharply. Some fields have seen dramatic reshaping. Others have barely moved in 15 years.
A journal that’s been B for three consecutive cycles in a growing discipline is a very different bet than one that just entered at B in a contracting field.
But there’s one more dimension worth examining: how well do ABDC tiers actually correlate with independent measures of journal quality?
Cross-referencing ABDC with Scimago: do the tiers hold up?
ABDC ratings are determined by expert panels. Scimago Journal Rank (SJR) is an independent, citation-based metric derived from the Scopus database. They measure different things — ABDC reflects panel consensus and disciplinary norms, SJR reflects citation impact.
I matched 2,038 of the 2,659 ABDC journals (76.6%) to Scimago’s 2024 dataset using ISSN. The 621 unmatched journals are likely niche or regional publications not indexed in Scopus.
The tiers do correlate — strongly
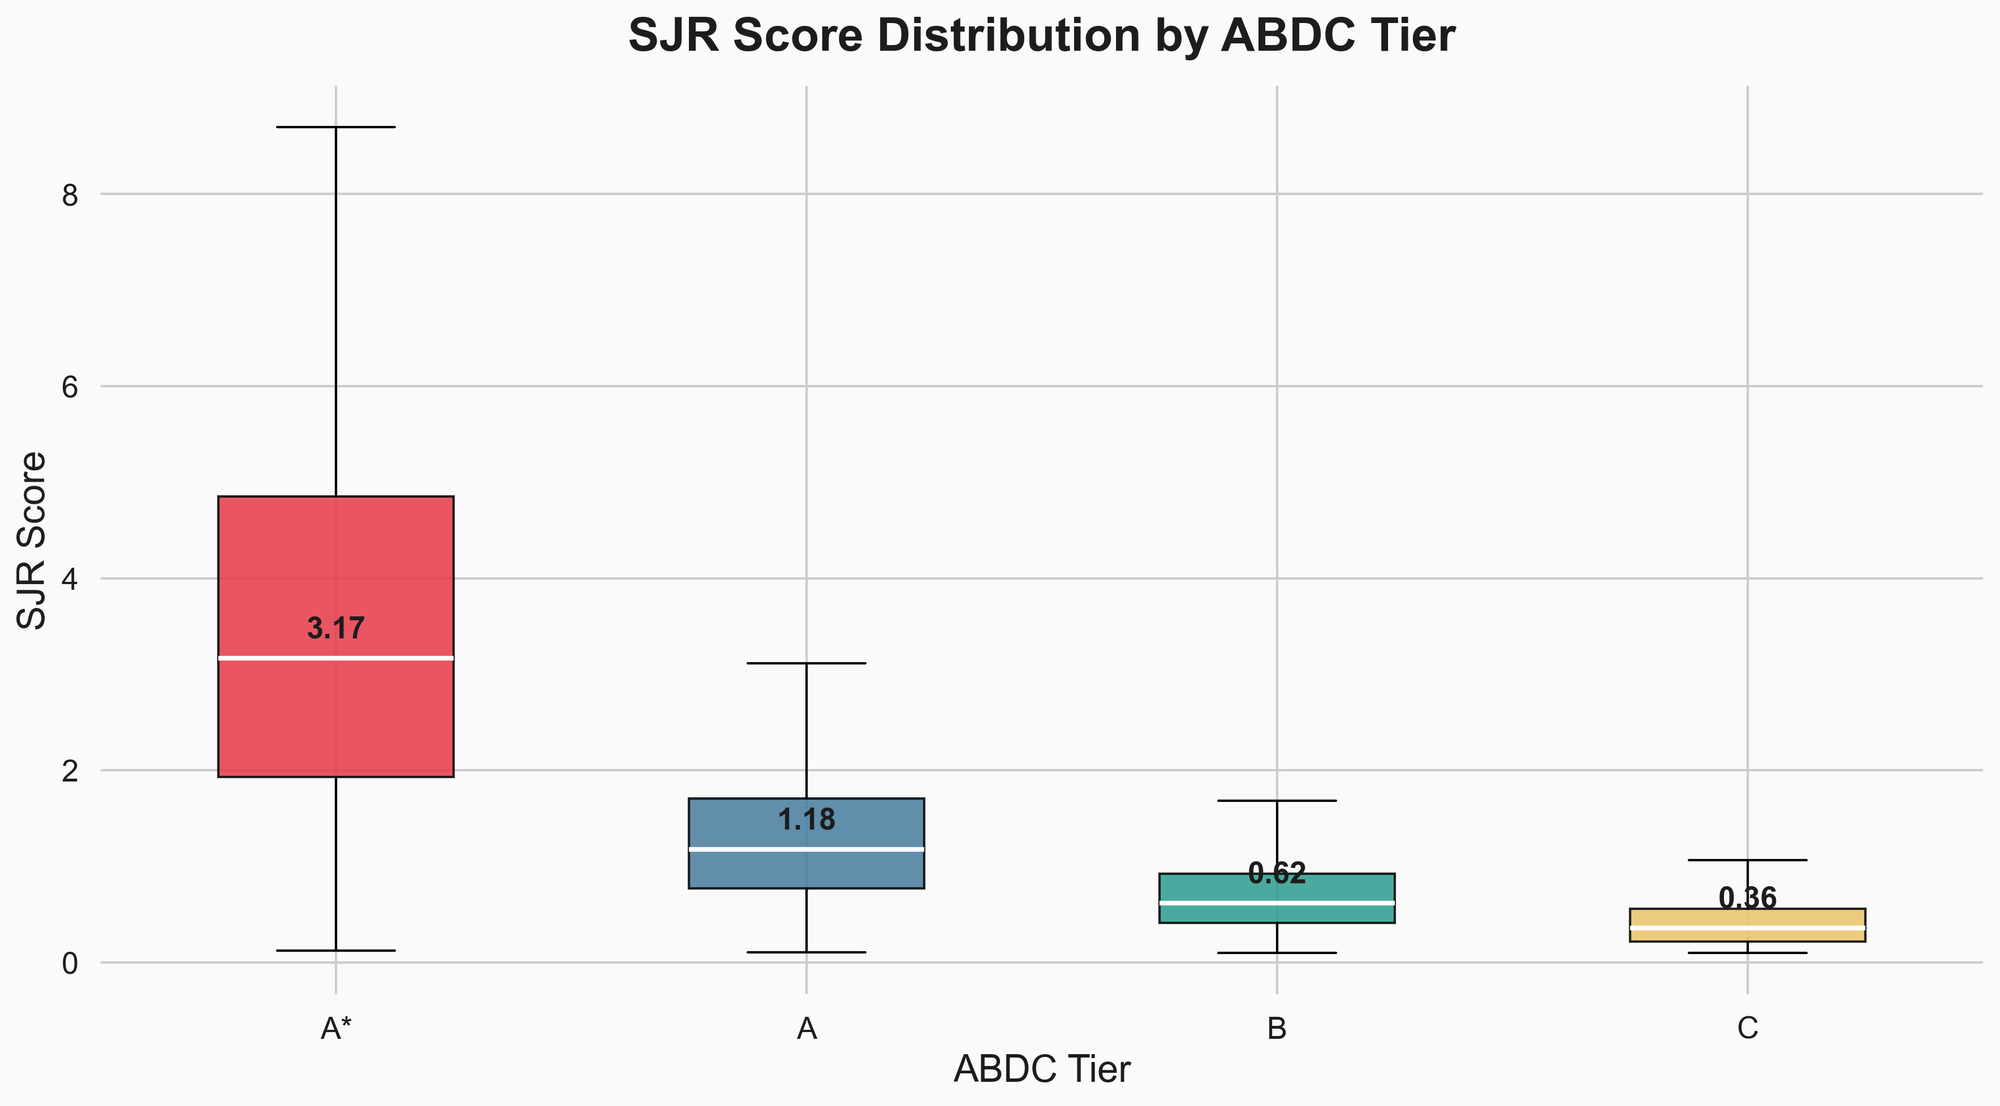
The median SJR scores by tier:
| Tier | Median SJR | Median H-Index | Median Citations/Doc (2yr) |
|---|---|---|---|
| A* | 3.17 | 142 | 5.54 |
| A | 1.18 | 82 | 3.37 |
| B | 0.62 | 43 | 2.58 |
| C | 0.36 | 24 | 1.49 |
Each step down the ABDC ladder roughly halves the SJR score. The tiers aren’t arbitrary — there’s a real and consistent relationship with citation impact.
SJR quartile alignment
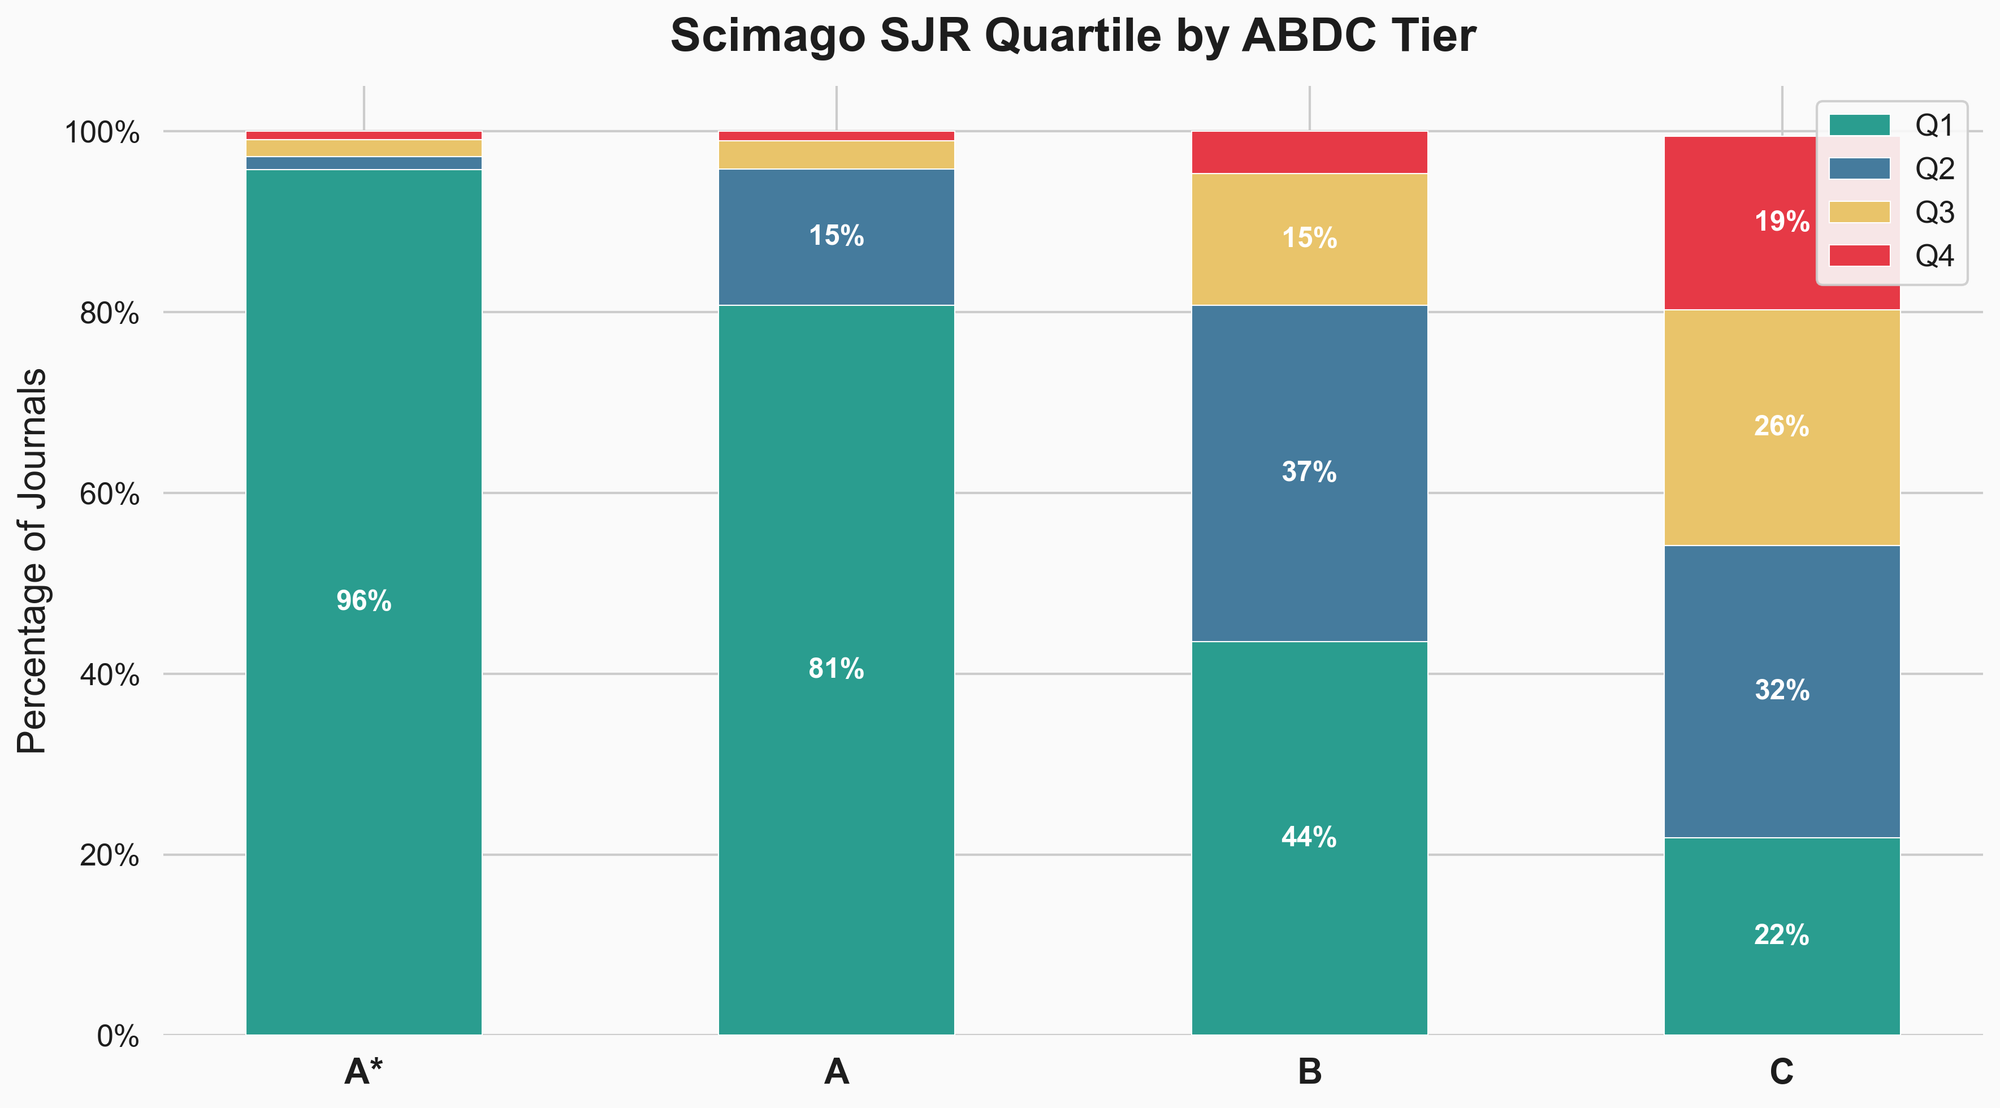
96% of ABDC A* journals are Scimago Q1. At A-tier, it’s 81%. By the time you reach B, it’s split — 44% Q1, 37% Q2. At C-tier, only 22% are Q1, and nearly one in five (19%) are Q4.
The alignment at the top is tight. The disagreement grows at the lower tiers.
But 115 C-tier journals are Scimago Q1
This is the most interesting mismatch.
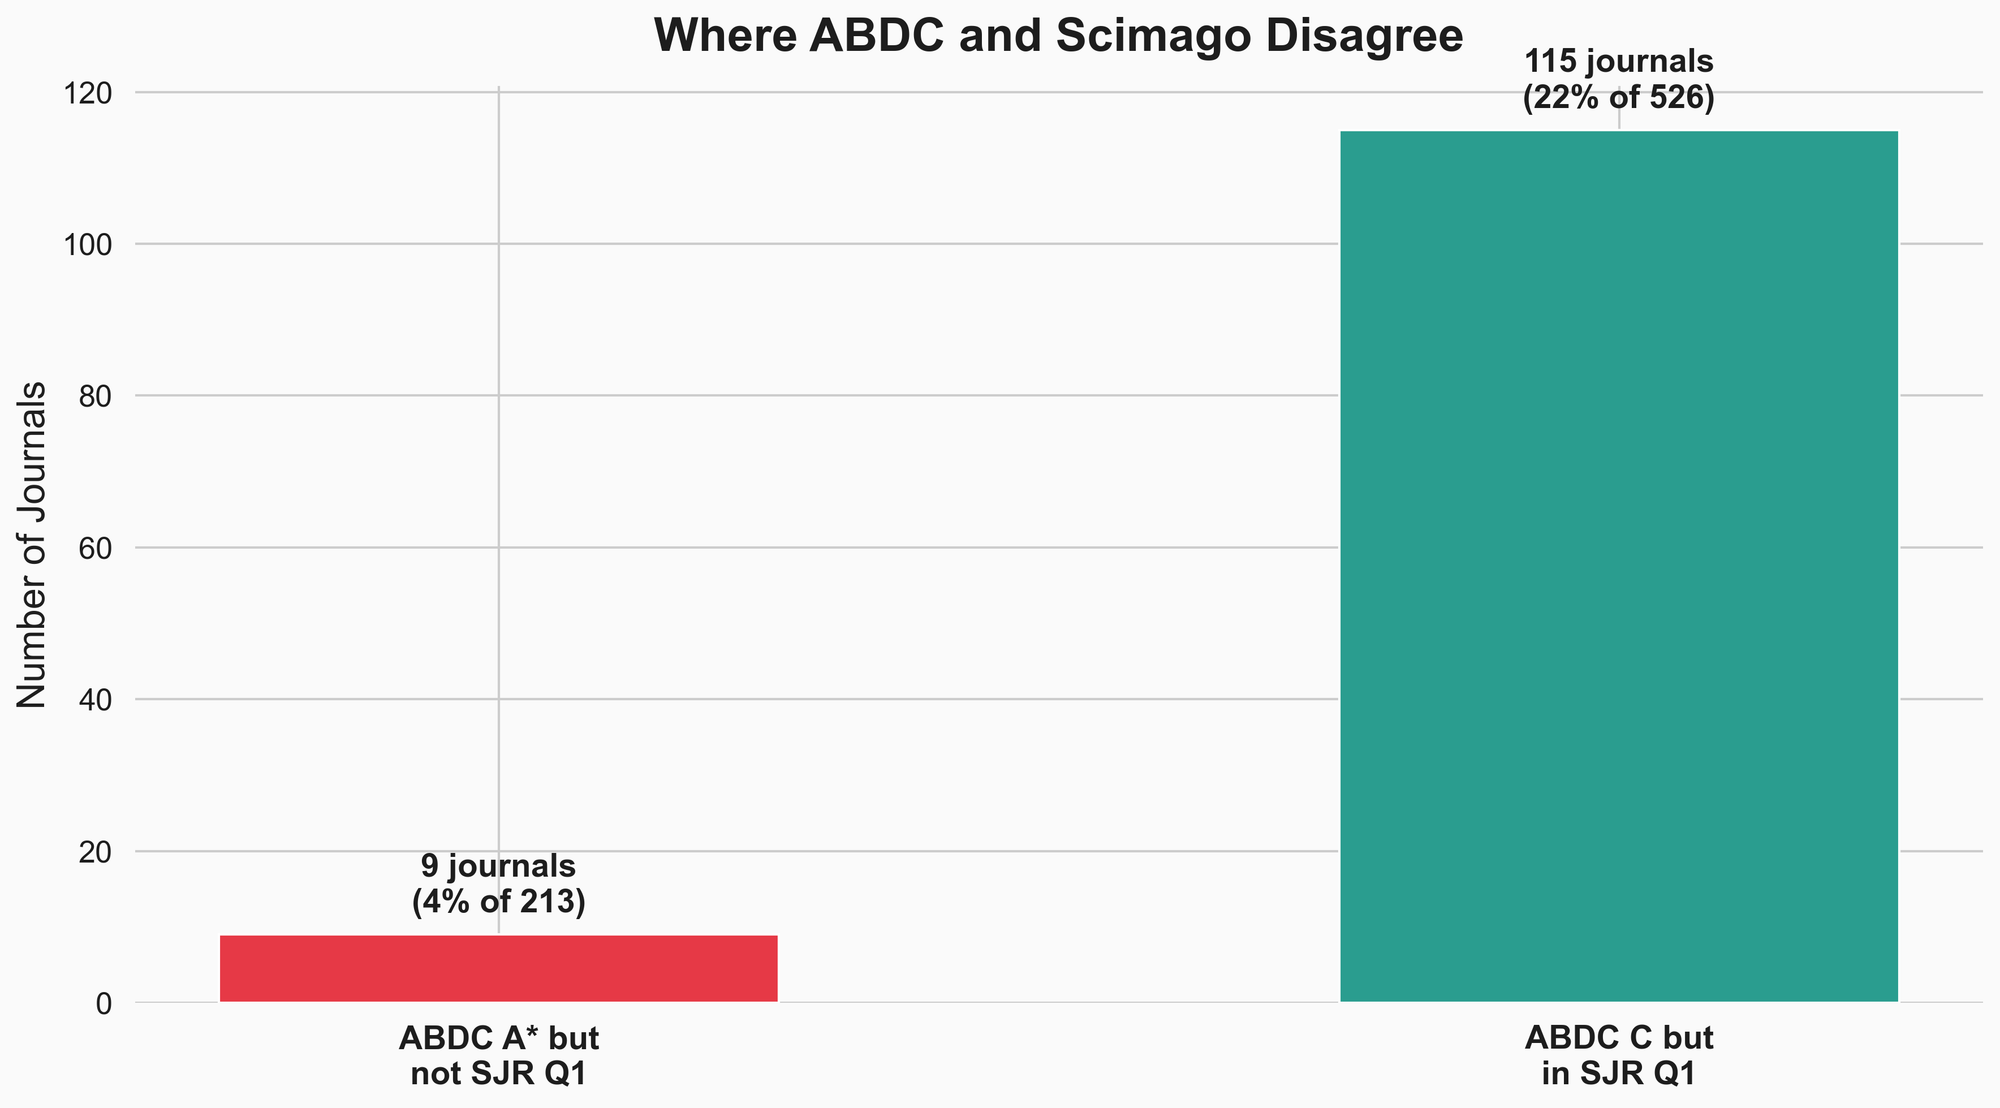
115 journals rated C by ABDC are in the top quartile by Scimago’s measure. That’s 22% of matched C-tier journals.
Meanwhile, only 9 A* journals (4%) fall outside Scimago Q1.
The asymmetry suggests ABDC is good at identifying the very top but more conservative about upgrading journals that have strong citation metrics but may lack other factors the panel considers — disciplinary prestige, editorial quality, regional focus, or simply having been reviewed in a frozen cycle.
For researchers, this means: a C-tier ABDC journal isn’t necessarily a low-impact journal. It may be high-impact in its Scopus field but underrated by the ABDC panel. Checking the SJR alongside the ABDC tier gives a more complete picture.
Discipline matters here too
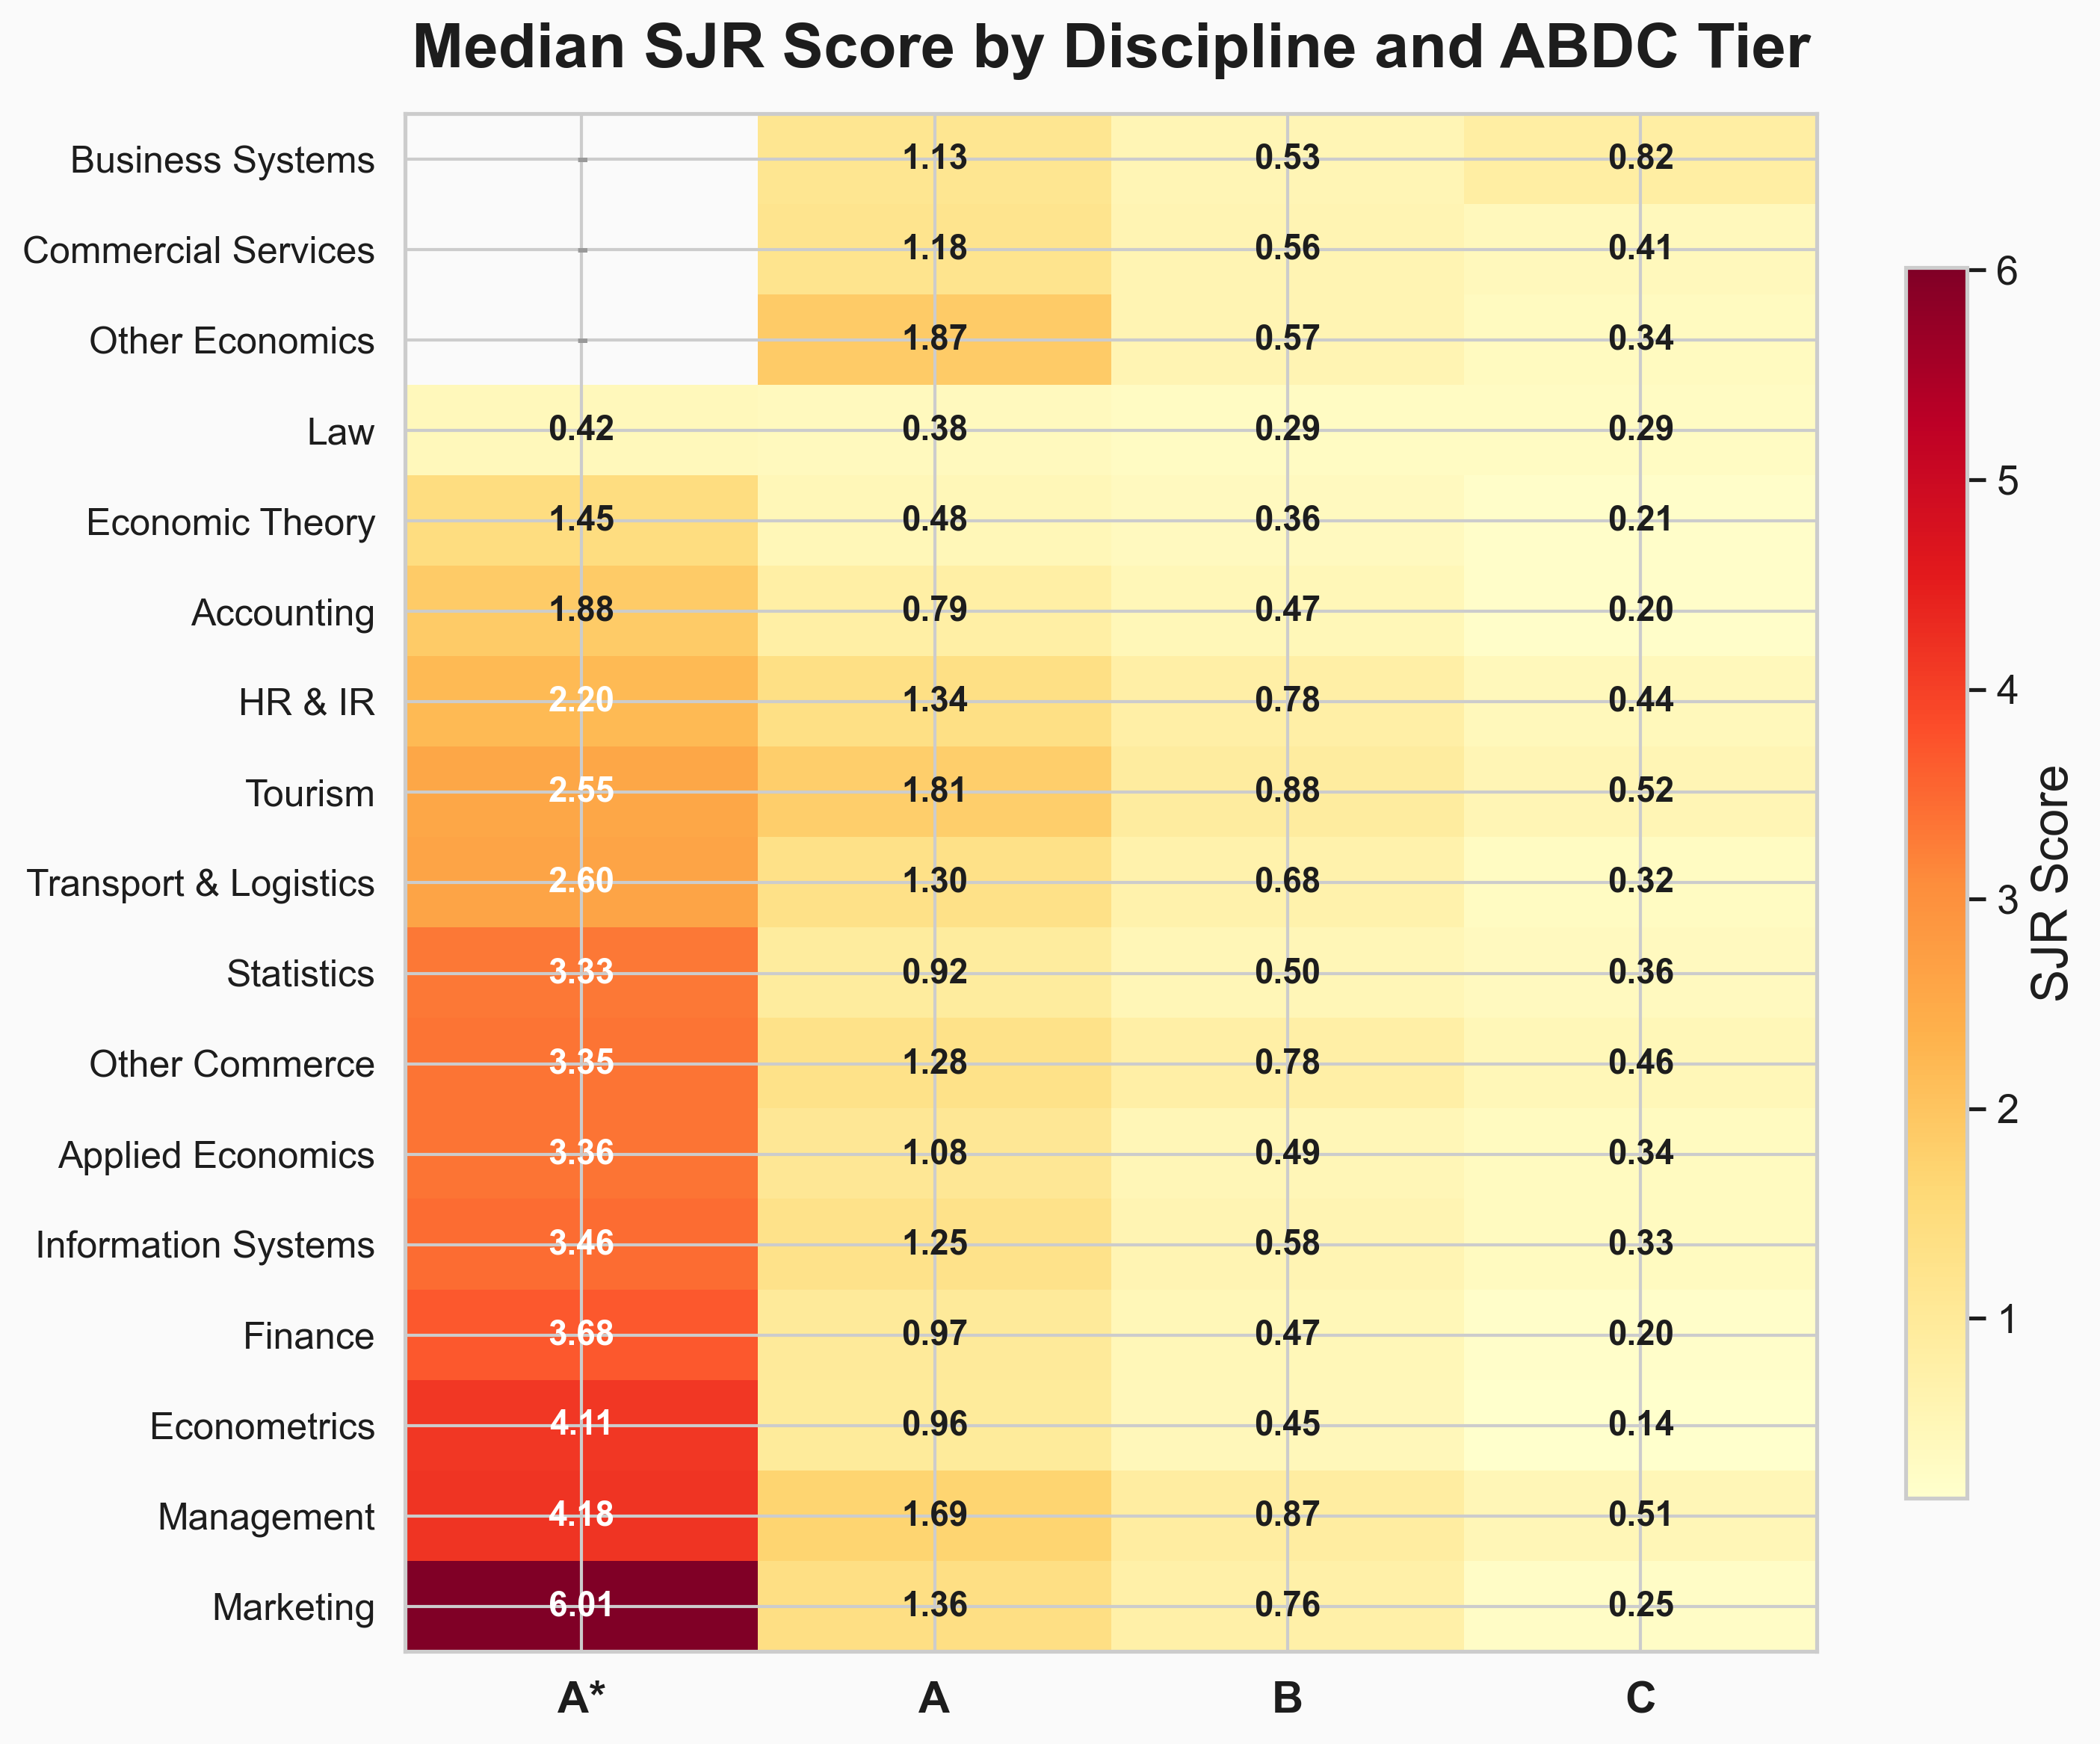
The heatmap reveals something important: ABDC tiers are not comparable across disciplines.
A Marketing A* journal has a median SJR of 6.01. A Law A* journal has a median SJR of 0.42. That’s a 14× difference. An A-tier Law journal (SJR 0.38) would fall below the median C-tier Management journal (SJR 0.51).
This isn’t because Law journals are worse — it’s because citation patterns differ fundamentally between disciplines. Law papers cite fewer sources and are cited less frequently. Management and Marketing papers are cited far more.
The practical implication: comparing ABDC tiers across disciplines is misleading. A B in Tourism (median SJR 0.88) and a B in Econometrics (median SJR 0.45) may carry the same ABDC label, but they represent very different levels of citation impact relative to their fields.
Summary
The ABDC list looks stable from the outside — roughly 2,700 journals, reviewed every three years. But the internal dynamics are more complex than the headline numbers suggest.
At the aggregate level, the list is shifting upward: more A* journals, fewer C journals, a composition that looks increasingly selective.
At the journal level, the forces driving this are different at the top and bottom. A* growth is largely earned — journals promoted from lower tiers. C-tier shrinkage is largely removals — journals dropped from the list and replaced by new entrants.
At the cycle level, the list is inconsistently managed. Some review cycles reclassify hundreds of journals. Others change almost nothing.
At the discipline level, the trends diverge sharply. Some fields have seen dramatic reshaping. Others have barely moved in 15 years.
Against independent citation metrics, the tiers hold up well at the top but diverge at the bottom — 22% of C-tier journals are Scimago Q1. And ABDC tiers are not comparable across disciplines due to fundamentally different citation cultures.
The ABDC list is one lens on journal quality. It’s a useful lens — the correlation with citation metrics is real. But it’s more dynamic, more discipline-dependent, and more inconsistently applied than a single snapshot suggests. Treat it as a starting point, not a verdict.
Data sources: ABDC journal quality lists (2010, 2013, 2016, 2019, 2022 final lists; 2025 draft). Scimago Journal & Country Rank (2024 dataset). Analysis performed using ISSN-based journal matching across all six ABDC lists and Scimago data. Field of Research codes mapped between 2008 and 2020 ANZSRC classification systems. The 2025 figures are based on the draft list and may change in the final version.